
Figures & data
Figure 1. Flow diagram of the study cohort. HGI: haemoglobin glycation index.
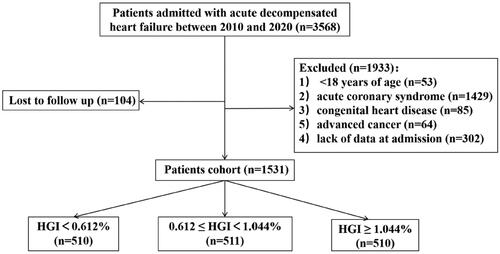
Table 1. Baseline characteristics by HGI group.
Figure 2. Multivariable-adjusted hazard ratios for (A) all-cause death, (B) cardiovascular death and (C) MACE based on restricted cubic spines and density plots for HGI. The solid and dotted lines represent hazard ratios and 95% confidence intervals, respectively. The coloured areas represent the distribution of the HGI in the study cohort. The model was adjusted for age, sex, hypertension status, diabetes status, atrial fibrillation status, prior infarction and stroke status, BMI, systolic blood pressure, diastolic blood pressure, heart rate, LVEF, BNP, haemoglobin, CRP, HDL-C, beta-blockers, ACEIs/ARBs, and spironolactone use. CI: confidence interval; HGI: haemoglobin glycation index; HR: hazard ratio; MACE: major adverse cardiac events.
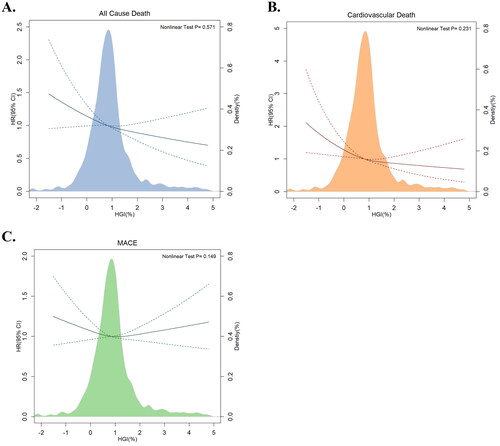
Figure 3. Kaplan–Meier plots of (A) all-cause death, (B) cardiovascular death and (C) MACE in the study cohort. HGI: haemoglobin glycation index; MACE: major adverse cardiac events.
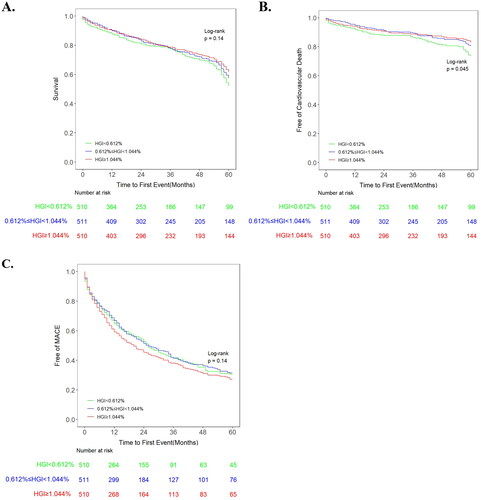
Figure 4. Adjusted survival curves for (A) all-cause death, (B) cardiovascular death and (C) MACE after adjustment for age, sex, hypertension, diabetes status, atrial fibrillation status, prior myocardial infarction and stroke status, BMI, systolic blood pressure, diastolic blood pressure, heart rate, LVEF, BNP, haemoglobin, CRP, HDL-C, beta-blockers, ACEIs/ARBs, and spironolactone use. HGI: haemoglobin glycation index; MACE: major adverse cardiac events.
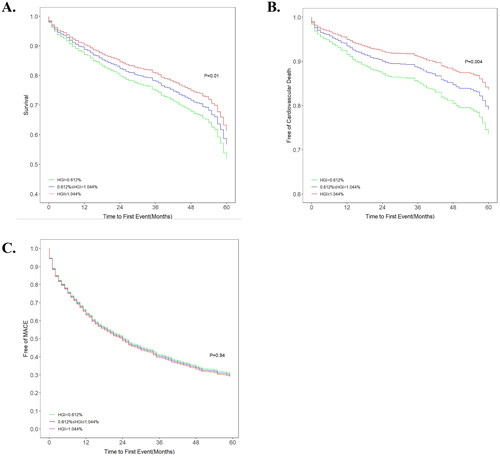
Table 2. Cox proportional hazard Model of HGI (as categorical variable).
Table 3. Cox proportional hazard Model of HGI (as continuous variable).
Figure 5. Forest plot of all-cause death in different subgroups. The adjusted models included age, sex, hypertension, diabetes status, atrial fibrillation status, prior myocardial infarction and stroke status, BMI, systolic blood pressure, diastolic blood pressure, heart rate, LVEF, BNP, haemoglobin, CRP, HDL-C, beta-blockers, ACEIs/ARBs, and spironolactone use. CI: confidence interval; eGFR: estimated glomerular filtration rate; HGI: haemoglobin glycation index; HR: hazard ratio; LVEF: left ventricular ejection fraction.
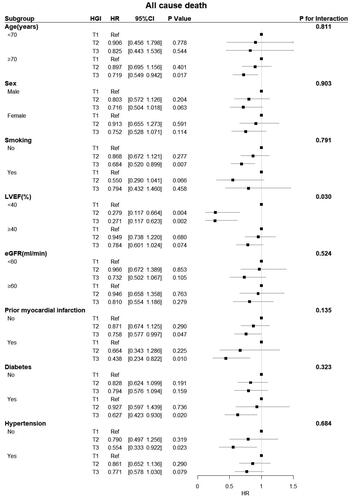
Figure 6. Forest plot of CV death in different subgroups. The adjusted models included age, sex, hypertension, diabetes status, atrial fibrillation status, prior myocardial infarction and stroke status, BMI, systolic blood pressure, diastolic blood pressure, heart rate, LVEF, BNP, haemoglobin, CRP, HDL-C, beta-blockers, ACEIs/ARBs, and spironolactone use. CI: confidence interval; eGFR: estimated glomerular filtration rate; HGI: haemoglobin glycation index; HR: hazard ratio; LVEF: left ventricular ejection fraction.
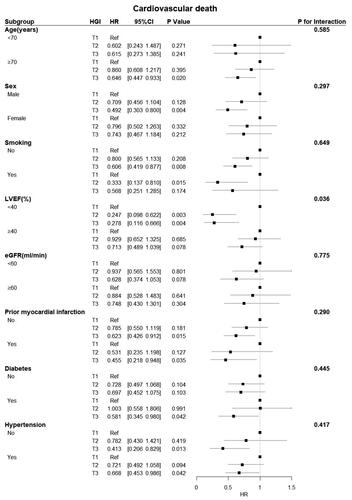
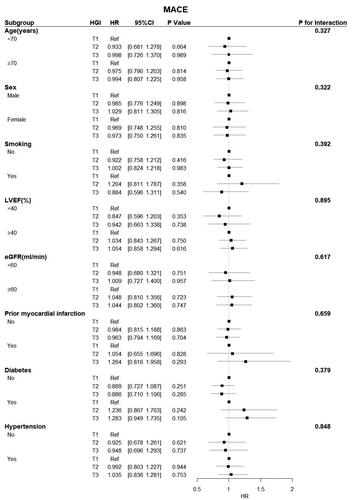
Figure 7. Forest plot of MACE in different subgroups. The adjusted models included age, sex, hypertension, diabetes status, atrial fibrillation status, prior myocardial infarction and stroke status, BMI, systolic blood pressure, diastolic blood pressure, heart rate, LVEF, BNP, haemoglobin, CRP, HDL-C, beta-blockers, ACEIs/ARBs, and spironolactone use. CI: confidence interval; eGFR: estimated glomerular filtration rate; HGI: haemoglobin glycation index; HR: hazard ratio; LVEF: left ventricular ejection fraction; MACE: major adverse cardiac events.
Data availability statement
The information and data of the study population were extracted from the Hospital Information System. The datasets are not publicly available because the individual privacy of the patients should be protected. However, the data are available from the corresponding author upon reasonable request.