
Figures & data
Table 1. Characteristics of healthy and UC couples.
Figure 1. Fecal microbiome analysis by 16s rRNA amplicon sequencing in health control, UC patients and their spouses (n = 12 in Health and Health-S groups, n = 13 in UC and UC-S groups). Relative abundances of bacterial phylum (A) and Top 20 genus (B) levels in study participants; LEfSe analyzes (LDA score, >3.0) to determine the taxonomic differences between two groups: Health and UC group (C); UC and UC-S group (D); (E) PCoA analysis of fecal microbiota beta-diversity confirms the segregation of all study participants.
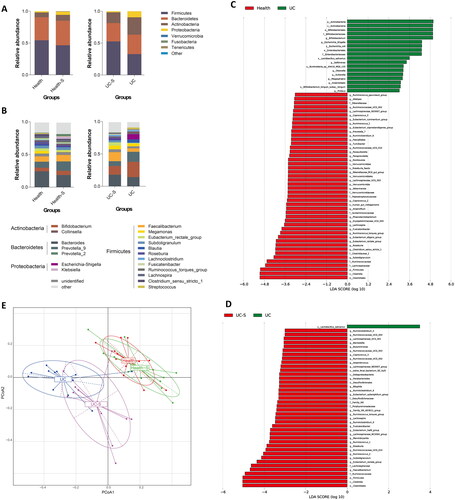
Figure 2. Differential class 2 pathways between two groups: (A) Health-S and UC; (B) UC-S and UC. Wilcoxon analysis was used for normalized abundance of each pathway (n = 12 in Health and Health-S groups, n = 13 in UC and UC-S groups; p < 0.05).
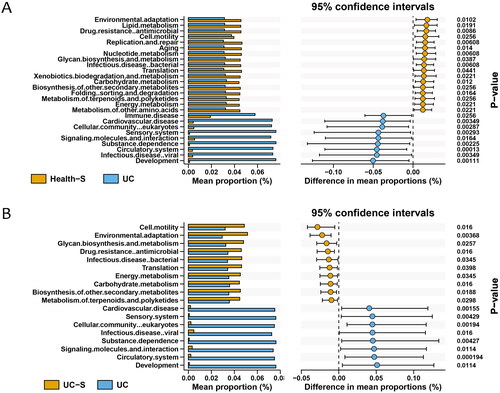
Figure 3. The relationship of differential class 2 pathways between UC group and two spouse groups. Eight pathways were changed significantly just between Health-S and UC groups. One color represents one pathway at class 1. KEGG pathway is divided into 3 classes. There are 7 class 1 pathways. 60 classes 2 pathways are subordinate to these 7 class 1 pathways. But the samples were enriched just in 6 class 1 pathways.
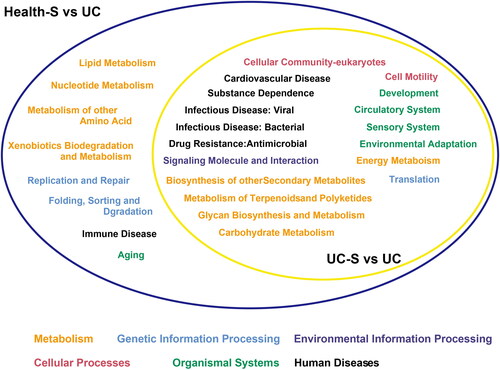
Figure 4. Heatmap of top 30 significantly changed class 3 pathways between two groups: (A) Health-S and UC; (B) UC-S and UC (n = 13 in Health, Health-S and UC groups, n = 12 in UC-S group).
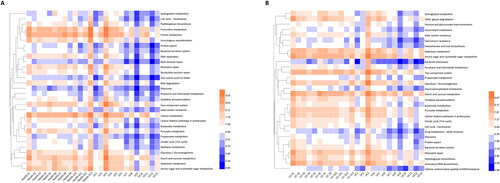
Figure 5. PCoA of analysis of genes of all study participants. (n = 13 in Health, Health-S and UC groups, n = 12 in UC-S group).
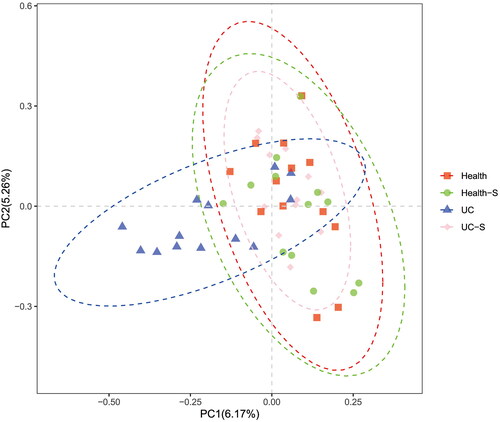
Table 2. Information of altered genes.
Supplemental Material
Download Zip (1.6 MB)Data availability statement
The data that support the findings of this study are available from the corresponding author, XL, upon reasonable request.