Figures & data
Figure 1 Effect of CMT‐3 on E‐10 conditioned medium as assessed by gelatinase activity assay (upper panel) and zymography (lower panel). E‐10 conditioned medium was plated on a [3H]‐proline labelled ECM plate. Different concentrations of CMT‐3 were added to selected wells at the start of the 2‐day incubation. Supernatants were removed and assayed for radioactivity. The residual radioactivity in each well was then solubilized with NaOH and measured. Each value represents triplicates (mean±standard deviation). In the lower panel E‐10 conditioned medium was instead analyzed by zymography.
![Figure 1 Effect of CMT‐3 on E‐10 conditioned medium as assessed by gelatinase activity assay (upper panel) and zymography (lower panel). E‐10 conditioned medium was plated on a [3H]‐proline labelled ECM plate. Different concentrations of CMT‐3 were added to selected wells at the start of the 2‐day incubation. Supernatants were removed and assayed for radioactivity. The residual radioactivity in each well was then solubilized with NaOH and measured. Each value represents triplicates (mean±standard deviation). In the lower panel E‐10 conditioned medium was instead analyzed by zymography.](/cms/asset/4d661fcb-bcd5-4acd-9562-6b4945af2a95/iann_a_130021_f0001_b.jpg)
Figure 2 ECM degradative activity mediated by MDA‐MB231 versus E‐10 cells. MDA‐MB 231 or E‐10 cells at a density of 2.8×10⁵ cells/cm2 were plated on a [3H]‐proline labelled ECM plate. Supernatants were removed after 2‐day incubation and assayed for radioactivity. The residual radioactivity in each well was then solubilized with NaOH and determined.
![Figure 2 ECM degradative activity mediated by MDA‐MB231 versus E‐10 cells. MDA‐MB 231 or E‐10 cells at a density of 2.8×10⁵ cells/cm2 were plated on a [3H]‐proline labelled ECM plate. Supernatants were removed after 2‐day incubation and assayed for radioactivity. The residual radioactivity in each well was then solubilized with NaOH and determined.](/cms/asset/04ab45b3-61ee-4f58-b095-bd0b06d3b47a/iann_a_130021_f0002_b.jpg)
Figure 3 Effect of CMT‐3 on extracellular MMP‐9 levels in E‐10 cells (Western blot analysis). Cells were cultured in serum‐free medium in the absence or presence of CMT‐3 for 48 hours. Conditioned medium was collected and centrifuged to remove cell debris. 2 µL aliquots were analyzed by Western blotting, using an anti‐MMP‐9 mAb. The location of a 92 kDa standard is indicated by the arrow.
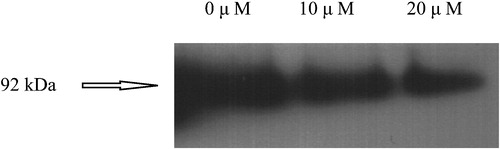
Figure 4 Effect of CMT‐3 on extracellular MMP‐9 in E‐10 cells analyzed by gelatinase activity assay. Cells were plated on ECM‐coated wells and incubated for 48 hours before supernatants were collected and analyzed by gelatine activity assay without and with APMA.
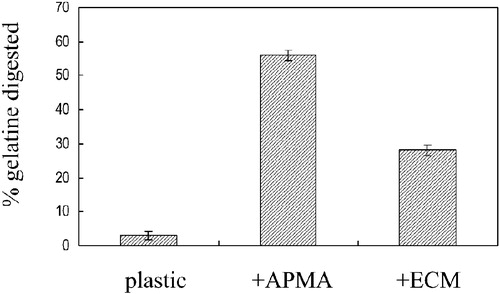
Figure 5 Effect of CMT‐3 on extracellular TIMP‐1 levels in E‐10 cells. Cells were cultured in serum‐free medium containing different concentrations of CMT‐3 for 48 hours. Conditioned medium was collected and centrifuged to remove cell debris. Samples were analyzed by Western blotting, using an anti‐TIMP‐1 mAb. The location of a TIMP‐1 standard is indicated by the arrow.
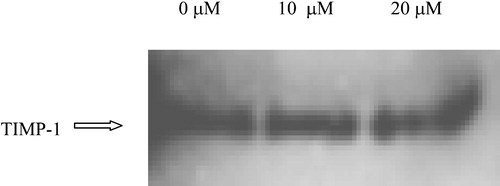
Figure 6 Effect of CMT‐3 on total secreted protein levels in E‐10 CM. E‐10 Cells were cultured in 35S TransLabel‐containing SFM overnight. CM was collected and electrophoresed on SDS‐PAGE. The gel was dried and exposed to X‐ray film.
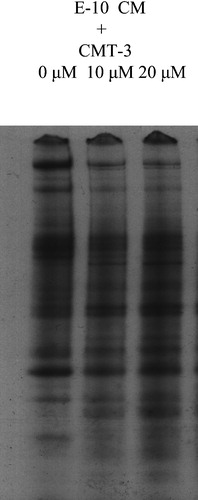
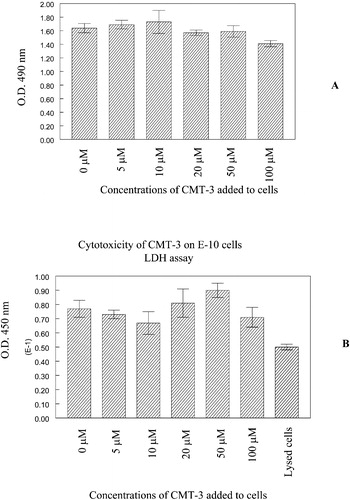
Figure 7 Cytotoxicity of CMT‐3 to E‐10 cells on R22 ECM. E‐10 cells were plated onto ECM‐coated wells in the presence of different concentrations of CMT‐3 as described in Methods section. At the end of a 48‐hour incubation, cell viability was analyzed by MTS (A) or LDH (B) assay. Further details are described in the Methods section.