Figures & data
Figure 1. A. Insulin resistance syndrome or syndrome X as initially described by Reaven in 1988. B. DeFronzo's ‘harmonious quartet’ showing abnormalities involved in the pathophysiology of type 2 diabetes.
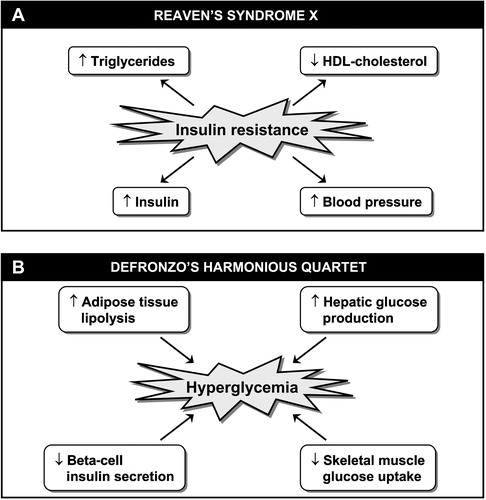
Figure 2. Distinction to be made between the conceptual definition of the most prevalent form of the metabolic syndrome(abdominal obesity) (panel A) versus clinical tools that have been proposed by various organizations/groups to identify patients likely to have the metabolic syndrome (panel B). Although finding patients with the metabolic syndrome is important in clinical practice, how to integrate this information in global cardiovascular risk assessment remains an unresolved issue (see text). NCEP‐ATP III = National Cholesterol Education Program‐Adult Treatment Panel III; IDF = International Diabetes Federation; WHO = World Health Organization; EGIR = European Group for the study of Insulin Resistance; AACE = American Association of Clinical Endocrinologists; HyperTG waist = hypertriglyceridemic waist; BMI = body mass index; WHR = waist‐to‐hip ratio. *Insulin resistance measured under hyperinsulinemic euglycemic conditions. †Includes family history of type 2 diabetes, polycystic ovary syndrome, sedentary lifestyle, advancing age and ethnic groups susceptible to type 2 diabetes.
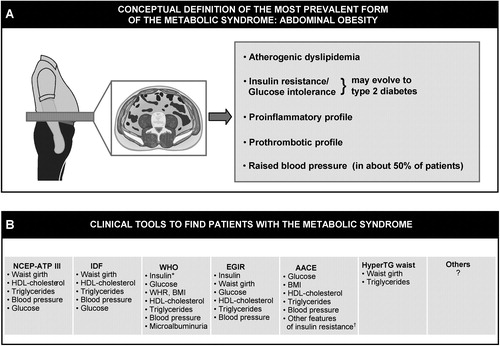
Figure 3. Working mechanistic model for the relation of excess visceral adipose tissue accumulation to the insulin resistant, dyslipidemic, prothrombotic and proinflammatory profile of abdominally obese patients.
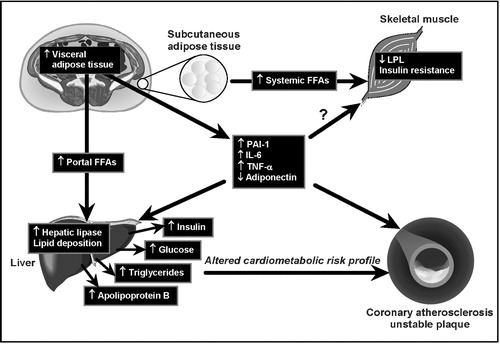
Figure 4. Triglyceride and HDL‐cholesterol levels in men according to LDL particle size (smaller<251.6 Å; larger ⩾251.6 Å) and HDL particle size (smaller<83.5 Å; larger ⩾83.5 Å). 1,2,3: significantly different from the corresponding subgroup P<0.0001. Thus, subjects with both small LDL and small HDL particles had the highest plasma triglycerides and the lowest HDL‐cholesterol concentrations.
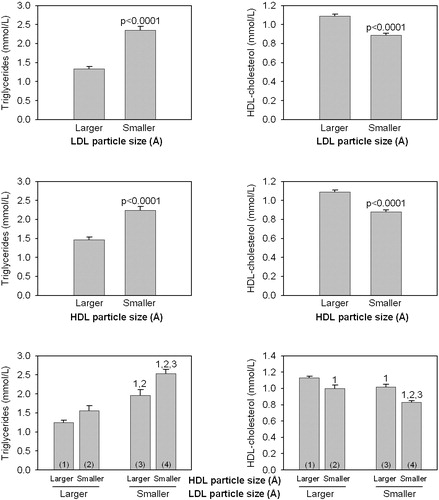
Figure 5. Hypothetical model by which visceral obesity is partly the consequence of a given neuro‐hormonal milieu preferentially partitioning the excess energy in the visceral fat depot rather than in subcutaneous adipose tissue.
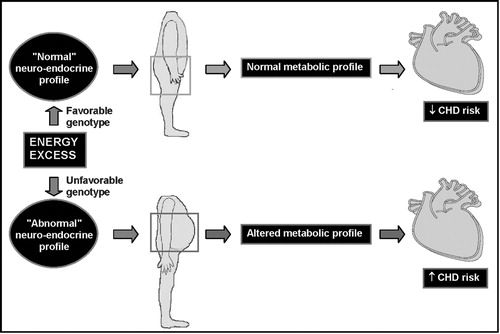
Table I. In vitro metabolic effects of adiponectin which may potentially protect against the development of type 2 diabetes and coronary heart disease.