Figures & data
Figure 1. Myocardial muscle is insulin‐sensitive. Whereas free fatty acids (FFA) represent the dominant fuel for cardiac muscle in the fasting state, an increase in circulating insulin concentrations inhibits lipolysis, thereby restraining FFA availability and promoting glucose uptake. By using 18F‐deoxyglucose (FDG), an analog of glucose (which is transported and phosphorylated in the same manner as D‐glucose but not further metabolized) labelled with a short‐lived radioactive isotope of fluorine (18F), positron‐emission tomography (PET) detects a signal that is proportional to the rate of myocardial glucose uptake. The figure shows FDG images of human heart muscle during a euglycaemic insulin clamp. On the left hand is a cross‐sectional scan of the left ventricular wall of a normal subject, on the right hand that of an insulin resistant patient with type 2 diabetes, both taken during a euglycaemic hyperinsulinaemic (1 mU.min−1. kg−1) clamp. The colour‐coded tracer uptake intensity indicates diffuse myocardial insulin resistance in the diabetic patient.
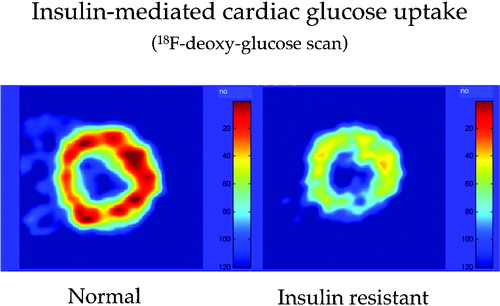
Figure 2. Independent contribution of insulin resistance of glucose uptake andß‐cell glucose insensitivity to 2‐hour plasma glucose concentrations in subjects spanning the range from normal glucose tolerance to overt diabetes (redrawn from reference Citation14).
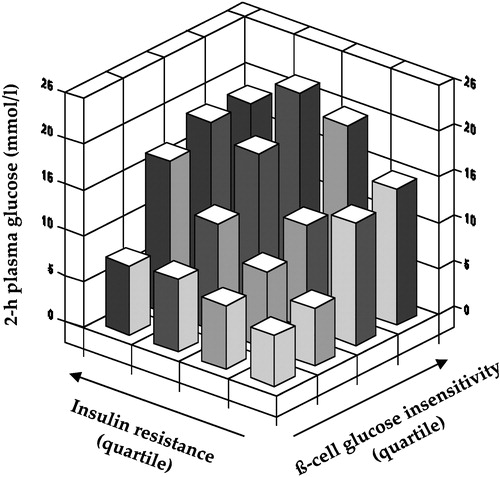
Figure 3. Dose‐response curves for whole body lipid oxidation rates (top) and whole body glucose disposal rates (bottom) during euglycaemic clamping over the physiologic range of plasma insulin concentrations in insulin sensitive (dotted lines) and insulin resistant non‐diabetic subjects (full lines). Higher lipid oxidation is associated with reduced insulin‐mediated glucose disposal, i.e. insulin resistance.
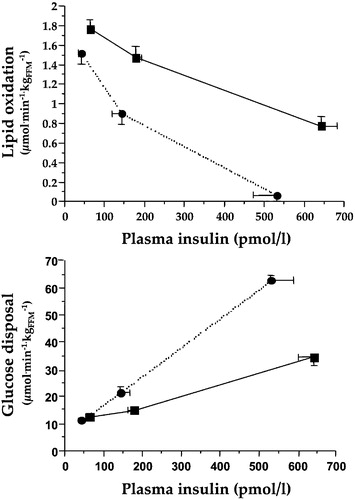
Figure 4. Point estimates of glucose‐induced thermogenesis at different percentiles (pct) of insulin sensitivity in 322 non‐diabetic subjects after statistical adjustment by gender, age, and body mass index. Insulin‐resistant subjects show a defect in glucose‐induced thermogenesis that is proportional to the degree of insulin resistance (redrawn from reference Citation27).
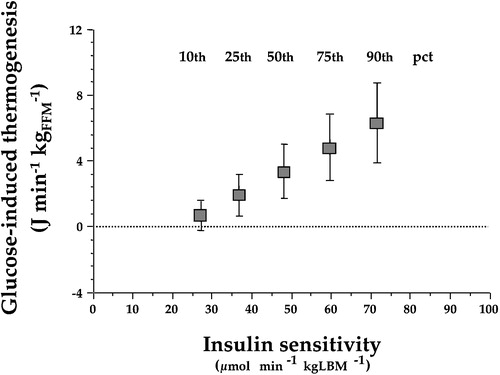
Figure 5. The graph shows the significant inverse relationship between mean arterial blood pressure and insulin sensitivity(as measured by the clamp technique) in 450 non‐diabetic subjects in the European Group for the Study of Insulin Resistance (EGIR) cohort. The regression lines are adjusted by gender and age, and are drawn across the observed range of insulin sensitivity. The lower line (lean) is the predicted relationship in a subject with a body mass index of 25 kg/m2, whereas the upper line (obese) is the function for an individual with a body mass index of 35 kg/m2. Obesity and insulin resistance work together to raise arterial blood pressure Citation29.
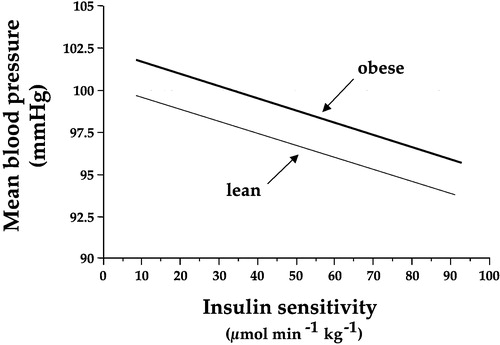
Figure 6. Diagram summarizing the dual vascular action of insulin. Through its receptors on the plasma membrane of endothelial cells, insulin stimulates the release of nitric oxide(NO, blocked by L‐NMMA and bypassed by direct provision of NO by nitroprusside) and a putative hyperpolarizing factor (blocked by oaubain), leading to vasodilatation; simultaneously, the release of endothelin‐1 contributes to maintain a vasoconstrictive tone.
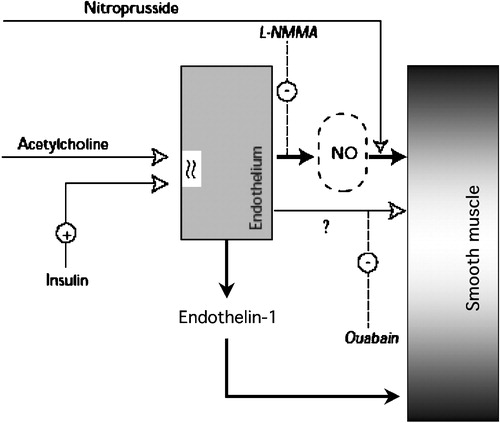
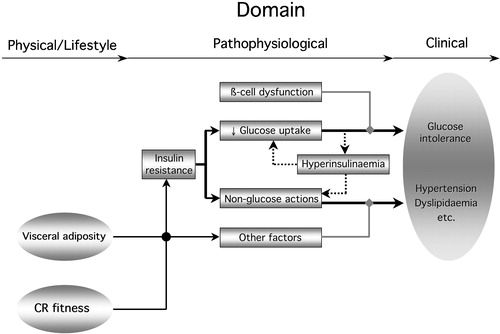
Figure 7. Diagram summarizing the relation of insulin resistance to the metabolic syndrome. Insulin resistance in the glucose pathway(reduced glucose uptake) couples with ß‐cell dysfunction to produce glucose intolerance. It also induces compensatory hyperinsulinaemia, feeding back on insulin resistance of glucose uptake. Non‐glucose insulin actions (lipids, blood pressure, endothelial function, autonomic nervous system) may themselves be resistant or, if normally sensitive, be overly stimulated by the hyperinsulinaemia. These non‐glucose insulin actions conspire with other factors (independent controls of blood pressure, lipid metabolism, etc.) to determine hypertension and dyslipidaemia. The clinical phenotype of the metabolic syndrome develops from this metabolic phenotype. Obesity, especially visceral fat accumulation, and poor cardio‐respiratory fitness (CR fitness) are physical phenotypes whose influence is transduced also via insulin resistance and other physiological factors.