578
Views
27
CrossRef citations to date
0
Altmetric
Original Article

Interactions between ghrelin, leptin and IGF-I affect metabolic syndrome and early atherosclerosis

, PhD , MD, , &
Pages 465-473 | Received 20 Dec 2007, Published online: 08 Jul 2009

Figures & data

Table I.  Main characteristics of the control and hypertensive cohorts by gender. Values are means (SD) or percentages.

Table II.  Use of selected medications among the hypertensive and control cohorts by gender. Data are n (%).

Figure 1.  Fasting plasma ghrelin concentrations (adjusted for age and sex) in subjects with the metabolic syndrome (MS) compared to those without in the leptin quartiles. Mean leptin levels (ng/mL) in leptin quartiles (95% confidence intervals) are: I: 3.5 (3.0–4.0); II: 6.6 (6.0–7.1); III: 10.6 (10.1–11.1); IV: 21.9 (21.3–22.4). Standard deviations for ghrelin levels varied from 205 to 249 pg/mL.
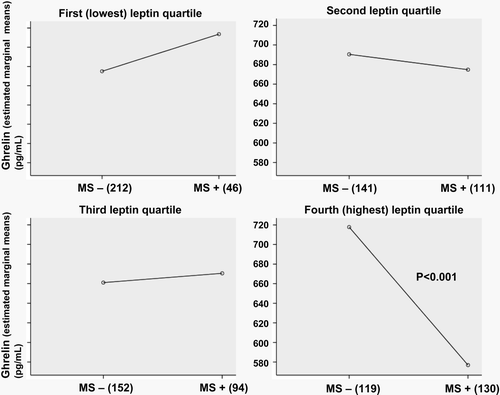
Figure 1.  Fasting plasma ghrelin concentrations (adjusted for age and sex) in subjects with the metabolic syndrome (MS) compared to those without in the leptin quartiles. Mean leptin levels (ng/mL) in leptin quartiles (95% confidence intervals) are: I: 3.5 (3.0–4.0); II: 6.6 (6.0–7.1); III: 10.6 (10.1–11.1); IV: 21.9 (21.3–22.4). Standard deviations for ghrelin levels varied from 205 to 249 pg/mL.

Figure 2.  Fasting plasma ghrelin concentrations of the study subjects in relation to the number of International Diabetes Federation criteria of the metabolic syndrome (MS) met in leptin quartiles. Standard deviations for ghrelin levels varied from 176 to 333 pg/mL.
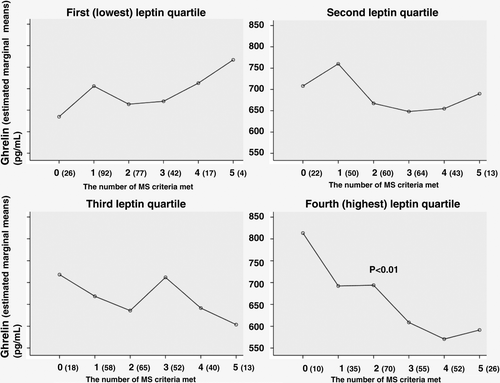
Figure 2.  Fasting plasma ghrelin concentrations of the study subjects in relation to the number of International Diabetes Federation criteria of the metabolic syndrome (MS) met in leptin quartiles. Standard deviations for ghrelin levels varied from 176 to 333 pg/mL.

Figure 3.  Odds ratios with 95% confidence intervals of ghrelin quartile for type 2 diabetes (the fourth ghrelin quartile is used as a reference category) obtained by logistic regression analysis adjusted for age and sex in the highest leptin quartile. Mean ghrelin levels in ghrelin quartiles (pg/mL) (95% confidence intervals) are: I: 376.6 (364.0–389.2); II: 574.3 (561.7–586.8); III: 743.8 (731.2–756.3); IV: 975.8 (963.2–988.3).
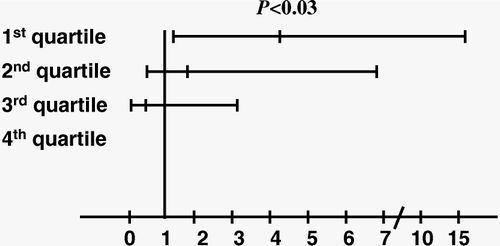
Figure 3.  Odds ratios with 95% confidence intervals of ghrelin quartile for type 2 diabetes (the fourth ghrelin quartile is used as a reference category) obtained by logistic regression analysis adjusted for age and sex in the highest leptin quartile. Mean ghrelin levels in ghrelin quartiles (pg/mL) (95% confidence intervals) are: I: 376.6 (364.0–389.2); II: 574.3 (561.7–586.8); III: 743.8 (731.2–756.3); IV: 975.8 (963.2–988.3).

Figure 4.  Adjusted (age, sex, smoking, systolic blood pressure, LDL-cholesterol and study group) means for ghrelin-leptin relation in different intima-media thickness (IMT) quartiles. Mean IMT values (mm) in IMT quartiles (95% confidence intervals) are: I: 0.69 (0.68–0.70); II: 0.77 (0.76–0.78); III: 0.84 (0.83–0.85); IV: 1.02 (1.02–1.03). Standard deviations for mean ghrelin-leptin relation varied from 72 to 133.
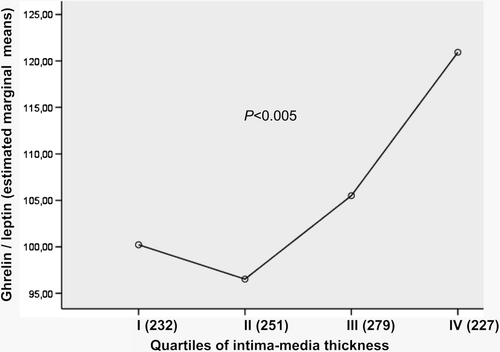
Figure 4.  Adjusted (age, sex, smoking, systolic blood pressure, LDL-cholesterol and study group) means for ghrelin-leptin relation in different intima-media thickness (IMT) quartiles. Mean IMT values (mm) in IMT quartiles (95% confidence intervals) are: I: 0.69 (0.68–0.70); II: 0.77 (0.76–0.78); III: 0.84 (0.83–0.85); IV: 1.02 (1.02–1.03). Standard deviations for mean ghrelin-leptin relation varied from 72 to 133.

Figure 5.  Mean intima-media thickness (IMT) (logarithmically transformed) of carotid arteries in relation to ghrelin and insulin-like growth factor I (IGF-I) quartiles. Mean IGF-I levels (ng/mL) in IGF-I quartiles (95% confidence intervals) are: I: 29.2 (27.1–31.3); II: 60.7 (58.6–62.9); III: 89.3 (87.1–91.5); IV: 139.4 (137.3–141.6). Standard deviations for mean IMT levels varied from 0.05 to 0.75.
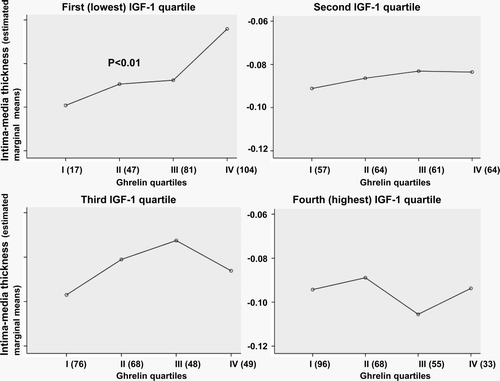
Figure 5.  Mean intima-media thickness (IMT) (logarithmically transformed) of carotid arteries in relation to ghrelin and insulin-like growth factor I (IGF-I) quartiles. Mean IGF-I levels (ng/mL) in IGF-I quartiles (95% confidence intervals) are: I: 29.2 (27.1–31.3); II: 60.7 (58.6–62.9); III: 89.3 (87.1–91.5); IV: 139.4 (137.3–141.6). Standard deviations for mean IMT levels varied from 0.05 to 0.75.

Reprints and Corporate Permissions

Please note: Selecting permissions does not provide access to the full text of the article, please see our help page How do I view content?

To request a reprint or corporate permissions for this article, please click on the relevant link below:

Academic Permissions

Please note: Selecting permissions does not provide access to the full text of the article, please see our help page How do I view content?

Obtain permissions instantly via Rightslink by clicking on the button below:

If you are unable to obtain permissions via Rightslink, please complete and submit this Permissions form. For more information, please visit our Permissions help page.