Figures & data
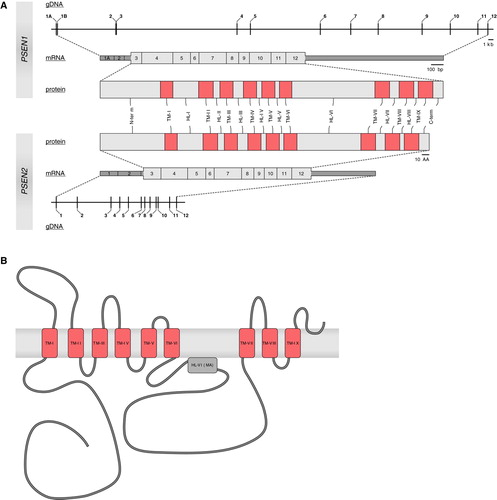
Figure 1. A: Schematic presentation of Amyloid Precusor Protein (APP) at the genomic, transcript, and protein level. Numbers (genomic and transcript) indicate exons and yellow-colored exons (transcript) designate alternatively spliced exons. At the transcript level, untranslated regions (UTR) are represented as dark gray boxes; coding regions are shown in light gray. Pink boxes indicate the portion of the protein from which the Aβ peptide and the APP intracellular domain (AICD) are formed. B: Different APP isoforms, produced by means of alternative splicing, that have been isolated from human tissue. Each transcript is named according to the protein that can be translated from the transcript, i.e. APP770 encodes an isoform containing 770 amino acids. C: Schematic overview of the two major APP processing pathways, i.e. the constitutive and the amyloidogenic pathway. Arrowheads indicate the respective cleavage sites (α-, β-, and γ-site); arrows indicate the cleavage event by the respective proteases (α-, β-, and γ-secretase).
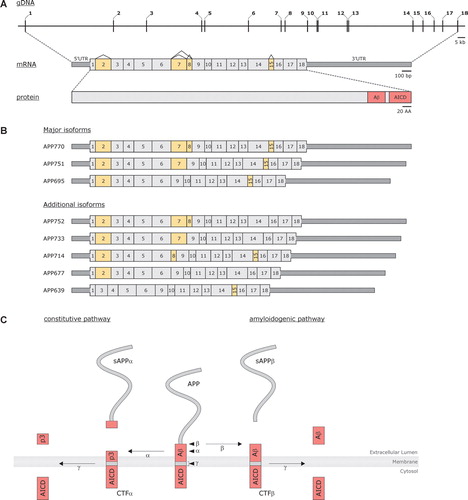
Figure 2. Schematical illustration of sequential Amyloid Precusor Protein (APP) cleavages producing amyloid Aβ peptide. In a first cleavage event, APP is cut at the Aβ N-terminus (β-secretase action) releasing its large soluble ectodomain (sAPPβ) in the extracellular space. Subsequently, the membrane-bound C-terminal stub (CTFβ) is cleaved downstream of the C-terminal end of Aβ by the γ-secretase complex. The four possible cleavage sites (γ-, γ′-, ζ-, and ε-sites) are indicated by scissors. The first C-terminal cut occurs at the ε-site (ε-site γ-secretase activity) and releases the APP intracellular domain (AICD) into the cytosol. The majority (∼90%) of CTFβ is cleaved between amino acids 49 and 50 (blue scissors) producing Aβ49; however, an alternative cleavage occurs between amino acids 48 and 49 (purple scissors) leading to the formation of Aβ48. Both membrane-bound peptides serve as substrates for subsequent cleavage events (ζ-site, γ- and γ′-site γ-secretase cleavage), cutting the peptides every three amino acids, ultimately producing Aβ40 and Aβ42 (or Aβ39 in case Aβ42 is not yet released into the extracellular lumen before the last cleavage event takes place). Amino acid positions (gray numbers) are numbered starting from the N-terminus of Aβ. Mutated amino acid positions are indicated in red, non-pathogenic variants are shown in green. Major cleavage events, giving rise to the production of Aβ40, are indicated by blue scissors. Minor cleavage events, producing Aβ42, are shown in purple.
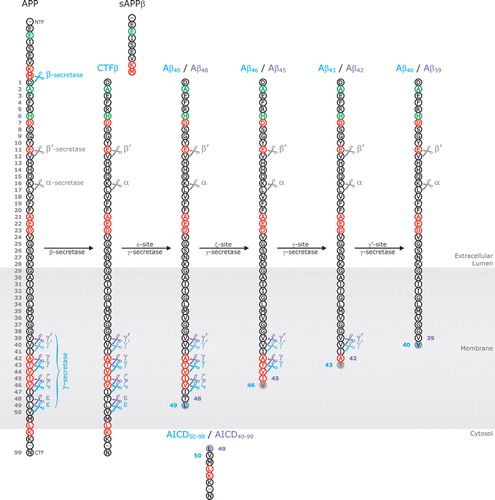
Table I. Overview of the effects of different types of mutations in Alzheimer's disease genes on the processing of APP and the production of Aβ.
Figure 3. A: Schematic presentations of the presenilins (PSEN1 and PSEN2) at genomic, transcript, and protein level. Numbers (genomic and transcript) indicate exons. At transcript level, untranslated regions are represented as dark gray boxes; coding regions are shown in light gray. Pink boxes indicate the transmembrane regions (TM) in both proteins, connected by hydrophilic loops (HL). B: Nine-transmembrane topology of PSEN1. Transmembrane regions (TM, pink boxes) are connected by hydrophilic loop structures. In hydrophilic loop VI a portion of the loop is associated with the membrane (MA, gray box).