
Figures & data
Figure 1. The relationship between detail and utility for the irrigator.
Figure 2. The VIA colour thresholds for water (Chameleon sensor), nitrate (nitrate test strip) and salt (VIA EC meter).
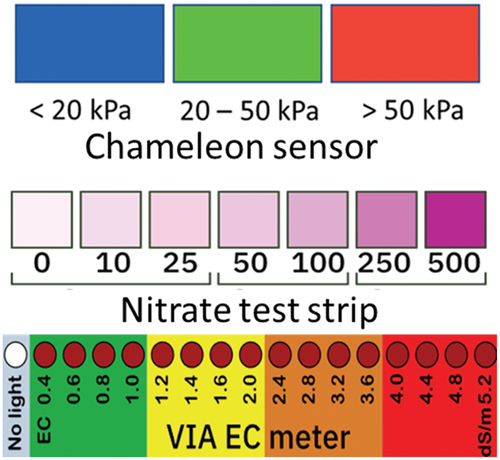
Table 1. Approximate relationship between nitrate concentration and amount of nitrate-nitrogen in the top 0.5 m.
Table 2. The Chameleon EC colours, range and meaning from soil water samples.
Table 3. A summary of a simplistic and requisite simplicity for each measurement device.
Figure 3. Common elements that make up a three-sensor array water pattern. The timing of irrigation events is shown by the arrow.
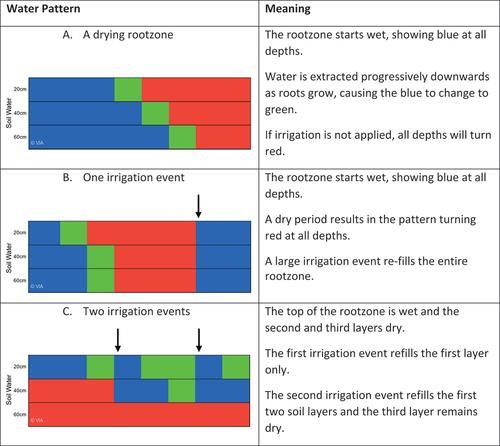
Figure 4. Common elements making up nitrate patterns and the accompanying water pattern. The timing of irrigation events is shown by the arrow.
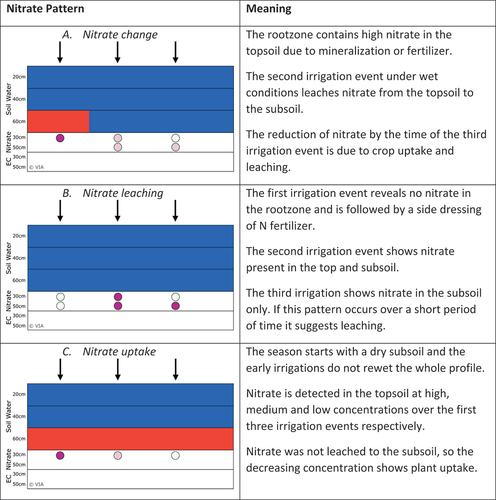
Figure 5. Common elements making up salt patterns and the accompanying water pattern. The timing of irrigation events is shown by the arrow.
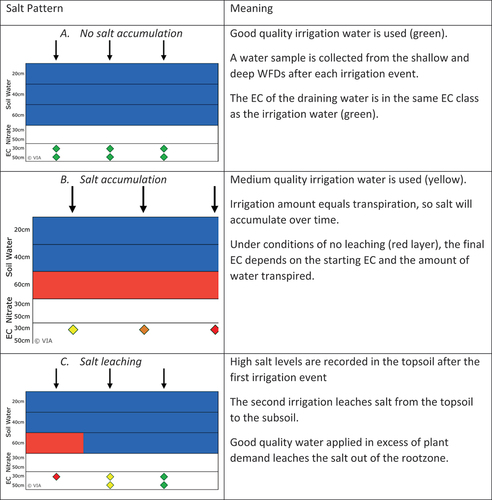
Figure 6. A combined water, nitrate and salt pattern.
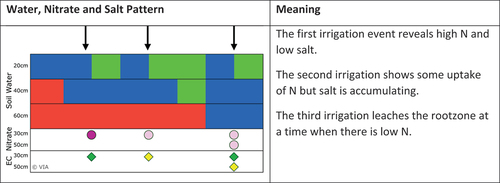
Table 4. The changes in yield from survey data covering 15 irrigation schemes in Tanzania and Malawi.
Table 5. The number of Chameleon sensors and WFD readings taken and reductions in water use, fertilizer use and conflict.