Figures & data
Figure 1 Flow diagram of the run‐in phase in HOMERUS.
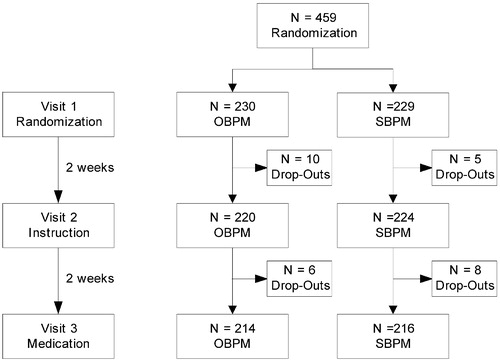
Table I. Baseline characteristics of the randomized patients for the total group, the office pressure (OP) group and the self‐pressure (SP) group.
Table II. Laboratory results at baseline for the total group, the office pressure (OP) group and the self‐pressure (SP) group.
Table IIIa. Result of random allocation using the minimization method.
Table IIIb. Result of random allocation using the randomization with four permuted blocks and without strata.
Table IIIc. Result of random allocation using the randomization with four permuted blocks and with 16 strata.
Figure 2 Twenty‐four‐hour ambulatory blood pressure measurement (ABPM) illustrated for each outcome factor that was used for the minimization method. ***p<0.001; **p<0.03. Data are depicted as mean±standard deviation.
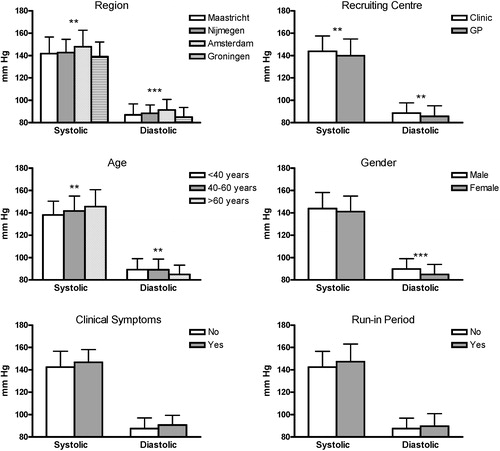
Figure 3 Twenty‐four‐hour ambulatory blood pressure measurements for the office pressure (OP) and self‐pressure (SP) group as randomized with different randomization procedures. *p<0.05. Data are depicted as mean±standard deviation.
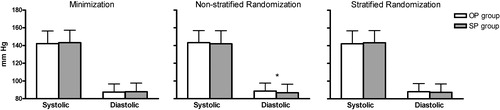
Figure 4 Twenty‐four‐hour ambulatory blood pressure measurements compared for patient characteristics that could influence prognosis. No LVH, patients without left ventricular hypertrophy; LVH, patients with left ventricular hypertrophy; Malb, microalbuminuria; Hchol, hypercholesterolaemia; DM, diabetes mellitus; Hcreat, elevated creatinine level. ***p<0.001;**p<0.03. Data are depicted as mean±standard deviation.
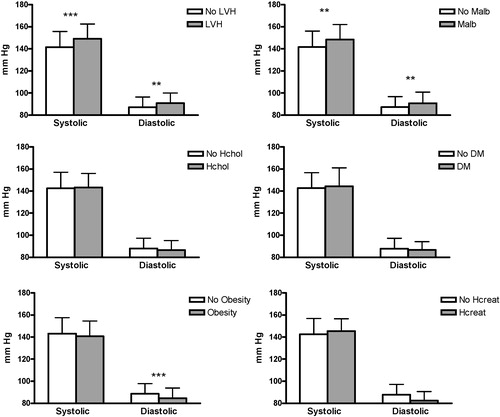
Table IV. Office blood pressure measurement (OBPM), ambulatory blood pressure measurement (ABPM) and self‐blood pressure measurement (SBPM) at enrolment.