2,731
Views
237
CrossRef citations to date
0
Altmetric
2007 Guidelines for the management of arterial hypertension

2007 ESH‐ESC Guidelines for the management of arterial hypertension

The Task Force for the Management of Arterial Hypertension of the European Society of Hypertension (ESH) and of the European Society of Cardiology (ESC)

Pages 135-232 | Published online: 08 Jul 2009

Figures & data

Table 1. Definitions and classification of blood pressure (BP) levels (mmHg)

Figure 1. Stratification of CV Risk in four categories. SBP: systolic blood pressure; DBP: diastolic blood pressure; CV: cardiovascular; HT: hypertension. Low, moderate, high and very high risk refer to 10 year risk of a CV fatal or non‐fatal event. The term ‘added’ indicates that in all categories risk is greater than average. OD: subclinical organ damage; MS: metabolic syndrome. The dashed line indicates how definition of hypertension may be variable, depending on the level of total CV risk.

Figure 1. Stratification of CV Risk in four categories. SBP: systolic blood pressure; DBP: diastolic blood pressure; CV: cardiovascular; HT: hypertension. Low, moderate, high and very high risk refer to 10 year risk of a CV fatal or non‐fatal event. The term ‘added’ indicates that in all categories risk is greater than average. OD: subclinical organ damage; MS: metabolic syndrome. The dashed line indicates how definition of hypertension may be variable, depending on the level of total CV risk.

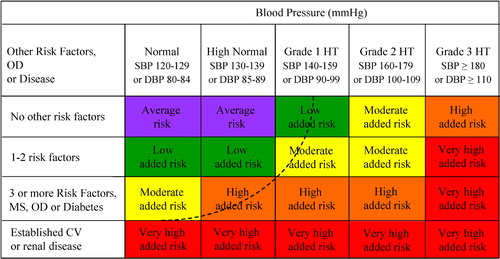
Table 2. Factors influencing prognosis

Table 3. High/Very high risk subjects

Table 4. Availability, prognostic value and cost of some markers of organ damage (scored from 0 to 4 pluses)

Table 5. Blood pressure thresholds (mmHg) for definition of hypertension with different types of measurement

Figure 2. Initiation of antihypertensive treatment.

Figure 2. Initiation of antihypertensive treatment.

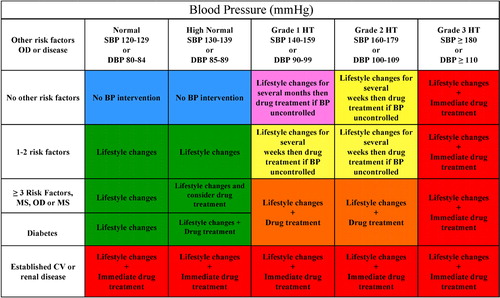
Table 6. Conditions favouring use of some antihypertensive drugs versus others

Table 7. Compelling and possible contraindications to use of antihypertensive drugs

Figure 3. Monotherapy versus combination therapy strategies.

Figure 3. Monotherapy versus combination therapy strategies.

Figure 4. Possible combinations between some classes of antihypertensive drugs. The preferred combinations in the general hypertensive population are represented as thick lines. The frames indicate classes of agents proven to be beneficial in controlled intervention trials.

Figure 4. Possible combinations between some classes of antihypertensive drugs. The preferred combinations in the general hypertensive population are represented as thick lines. The frames indicate classes of agents proven to be beneficial in controlled intervention trials.

Table 8. Hypertensive Emergencies

Reprints and Corporate Permissions

Please note: Selecting permissions does not provide access to the full text of the article, please see our help page How do I view content?

To request a reprint or corporate permissions for this article, please click on the relevant link below:

Academic Permissions

Please note: Selecting permissions does not provide access to the full text of the article, please see our help page How do I view content?

Obtain permissions instantly via Rightslink by clicking on the button below:

If you are unable to obtain permissions via Rightslink, please complete and submit this Permissions form. For more information, please visit our Permissions help page.