262
Views
7
CrossRef citations to date
0
Altmetric
ORIGINAL ARTICLE

Increased perfusion pressure enhances the expression of endothelin (ETB) and angiotensin II (AT1, AT2) receptors in rat mesenteric artery smooth muscle cells

, , &
Pages 78-85 | Received 01 Dec 2008, Published online: 08 Jul 2009

Figures & data

Figure 1. ETB and AT2 mRNA expression from rat mesenteric artery. No perfusion pressure (C), normal perfusion pressure (NP) and high perfusion pressure (HP) for 4 h. *p<0.05.
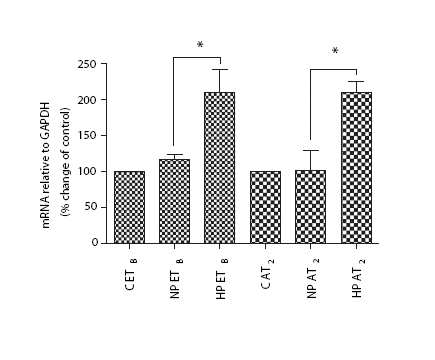
Figure 1. ETB and AT2 mRNA expression from rat mesenteric artery. No perfusion pressure (C), normal perfusion pressure (NP) and high perfusion pressure (HP) for 4 h. *p<0.05.

Figure 2. (a) ETB mRNA expression from rat mesenteric artery perfused with Actinomycin D. Organ culture (OC), normal perfusion pressure (NP) and high perfusion pressure (HP) for 2 and 4 h of incubation. (b) AT2 mRNA expression from rat mesenteric artery perfused with Actinomycin D. Organ culture (OC), normal perfusion pressure (NP) and high perfusion pressure (HP) for 2 and 4 h of incubation.
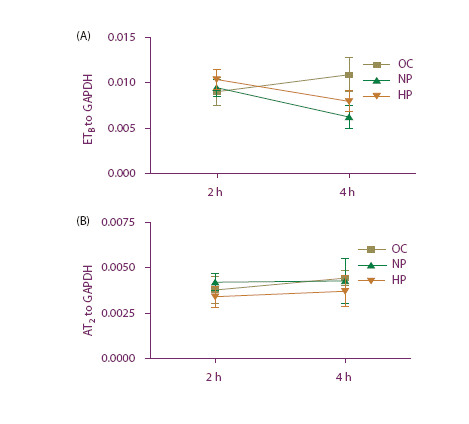
Figure 2. (a) ETB mRNA expression from rat mesenteric artery perfused with Actinomycin D. Organ culture (OC), normal perfusion pressure (NP) and high perfusion pressure (HP) for 2 and 4 h of incubation. (b) AT2 mRNA expression from rat mesenteric artery perfused with Actinomycin D. Organ culture (OC), normal perfusion pressure (NP) and high perfusion pressure (HP) for 2 and 4 h of incubation.

Figure 3. ETB protein expression from rat mesenteric artery. Normal perfusion pressure (NP) and high perfusion pressure (HP) for 1, 3 and 17 h. *p<0.05.
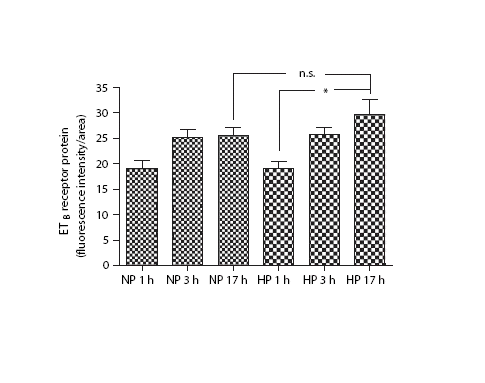
Figure 3. ETB protein expression from rat mesenteric artery. Normal perfusion pressure (NP) and high perfusion pressure (HP) for 1, 3 and 17 h. *p<0.05.
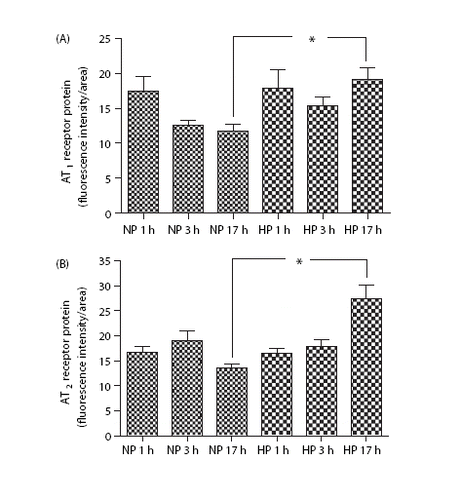
Figure 4. (a) AT1 protein expression from rat mesenteric artery. Normal perfusion pressure (NP) and high perfusion pressure (HP) for 1, 3 and 17 h. *p<0.05. (b) AT2 protein expression from rat mesenteric artery. Normal perfusion pressure (NP) and high perfusion pressure (HP) for 1, 3 and 17 h. *p<0.05.

Figure 4. (a) AT1 protein expression from rat mesenteric artery. Normal perfusion pressure (NP) and high perfusion pressure (HP) for 1, 3 and 17 h. *p<0.05. (b) AT2 protein expression from rat mesenteric artery. Normal perfusion pressure (NP) and high perfusion pressure (HP) for 1, 3 and 17 h. *p<0.05.

Figure 5. (a) Immunohistochemistry. Left top: AT1 protein expression during normal perfusion pressure (NP) and 1 h. Right top: AT1 protein expression during NP and 17 h. Left bottom: AT1 protein expression during high perfusion pressure (HP) and 1 h. Right bottom: AT1 protein expression during HP and 17 h. (b) Immunohistochemistry. Left top: AT2 protein expression during NP and 1 h. Right top: AT2 protein expression during NP and 17 h. Left bottom: AT2 protein expression during HP and 1 h. Right bottom: AT2 protein expression during HP and 17 h. (c) Immunohistochemistry. Left top: ETB protein expression during NP and 1 h. Right top: ETB protein expression during NP and 17 h. Left bottom: ETB protein expression during HP and 1 h. Right bottom: ETB protein expression during HP and 17 h.
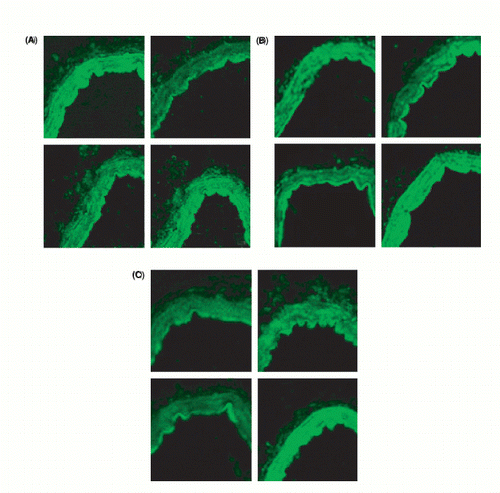
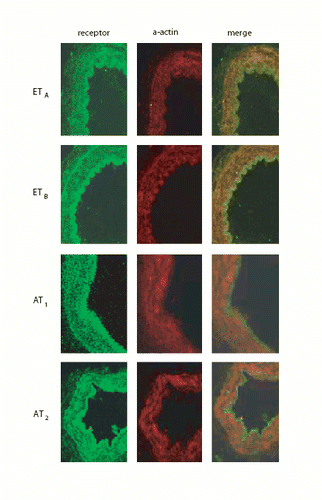
Figure 5. (a) Immunohistochemistry. Left top: AT1 protein expression during normal perfusion pressure (NP) and 1 h. Right top: AT1 protein expression during NP and 17 h. Left bottom: AT1 protein expression during high perfusion pressure (HP) and 1 h. Right bottom: AT1 protein expression during HP and 17 h. (b) Immunohistochemistry. Left top: AT2 protein expression during NP and 1 h. Right top: AT2 protein expression during NP and 17 h. Left bottom: AT2 protein expression during HP and 1 h. Right bottom: AT2 protein expression during HP and 17 h. (c) Immunohistochemistry. Left top: ETB protein expression during NP and 1 h. Right top: ETB protein expression during NP and 17 h. Left bottom: ETB protein expression during HP and 1 h. Right bottom: ETB protein expression during HP and 17 h.

Figure 6. Co‐localization. First column shows protein receptor distribution for the receptors. Second column shows alpha‐actin distribution. Third column shows columns 1 and 2 merged together depicting co‐localization.

Figure 6. Co‐localization. First column shows protein receptor distribution for the receptors. Second column shows alpha‐actin distribution. Third column shows columns 1 and 2 merged together depicting co‐localization.

Reprints and Corporate Permissions

Please note: Selecting permissions does not provide access to the full text of the article, please see our help page How do I view content?

To request a reprint or corporate permissions for this article, please click on the relevant link below:

Academic Permissions

Please note: Selecting permissions does not provide access to the full text of the article, please see our help page How do I view content?

Obtain permissions instantly via Rightslink by clicking on the button below:

If you are unable to obtain permissions via Rightslink, please complete and submit this Permissions form. For more information, please visit our Permissions help page.