
Figures & data
Table 1. The quartiles of subscapular to triceps ratio in boys and girls aged 7–17 years.
Figure 1. Mean values of BMI and WC in boys and girls with different patterns of fat distribution. (BMI, body mass index. WC, waist circumference. STR, subscapular to triceps skinfold thickness ratio. Q1, STR < 25th. Q4, STR ≥ 75th).
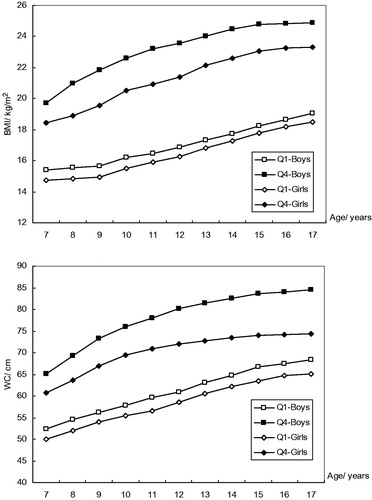
Figure 2. Mean values of SBP and DBP in boys and girls with different patterns of fat distribution. (SBP, systolic blood pressure. DBP, diastolic blood pressure. STR, subscapular to triceps skinfold thickness ratio. Q1, STR < 25th. Q4, STR ≥ 75th).
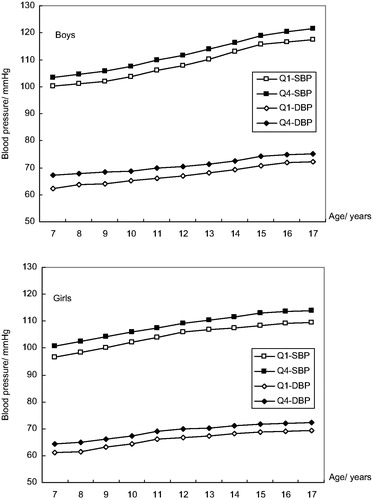
Table 2. Comparisons of Z-score for BMI, WC, WHtR, SBP and DBP in different groups categorized by STR.
Table 3. Prevalence of overweight, general obesity, abdominal obesity and relatively high BP in different groups categorized by STR.