
Figures & data
Figure 1. Map of Nigeria showing the division into the geopolitical zones and population figures according to 2006 nationwide census [Citation11]. (M stands for Million).
![Figure 1. Map of Nigeria showing the division into the geopolitical zones and population figures according to 2006 nationwide census [Citation11]. (M stands for Million).](/cms/asset/9b59122e-fc10-40b1-b3b8-e559bdef7790/iblo_a_1612706_f0001_b.jpg)
Figure 2. Study design of the REMAH study.
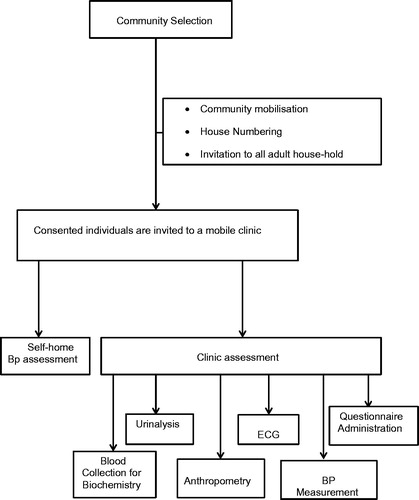
Figure 3. Cross-classification of hypertension. Diagnostic threshold for out-of-office BP assessment depicted include self-measured home BP (home), Day-time ambulatory BP (Day), Night time ambulatory BP (Night) and 24 hour ambulatory BP (24-h).
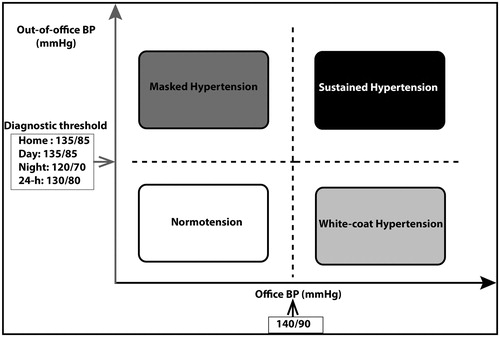
Figure 4. Terminal digit of the five consecutive systolic and diastolic blood pressure (BP) readings (4890 readings, 2445 each of systolic and diastolic BP measurements taken from each of the 490 participants). Numbers along the horizontal axis denote the terminal digits and the percentages are on the vertical axis. The reference line of 20% denotes the expected. *P for equal proportions (20% expected for each of the five end digits).
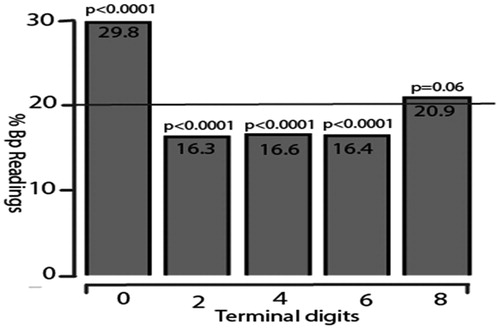
Table 1. Characteristics of participants by sex and study site.
Table 2. Haemodynamic characteristics by sex and study site.