Figures & data
Table 1. General descriptives of the physicians and the general practitioners’ practices.
Figure 1. Average number of daily measurements in different measurement periods.
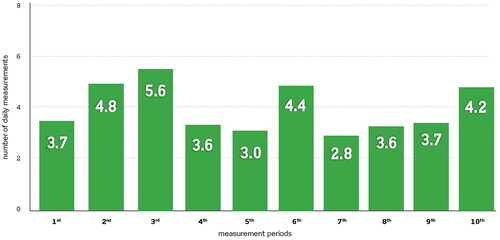
Figure 2. The proportion of patients in different blood pressure categories.
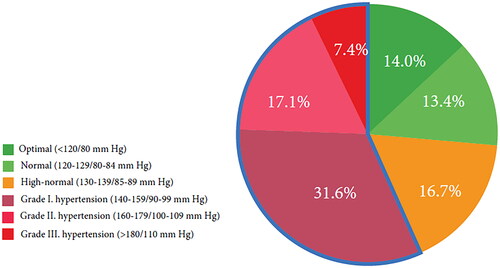
Table 2. The effect of different confounders for the blood pressure and heart rate.
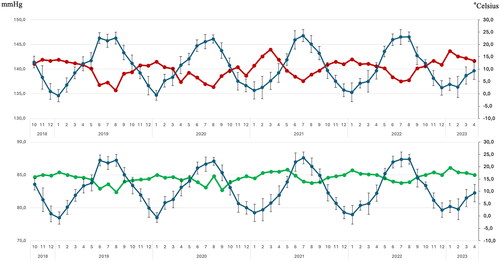
Figure 3. Seasonal changes in systolic and diastolic blood pressure and calculated average daily temperature values during the measurement period. Red line: systolic blood pressure, green line: diastolic blood pressure, blue line: temperature values in °Celsius ± SD.