
Figures & data
Figure 1. Total number of treatment courses per year and treatment center.
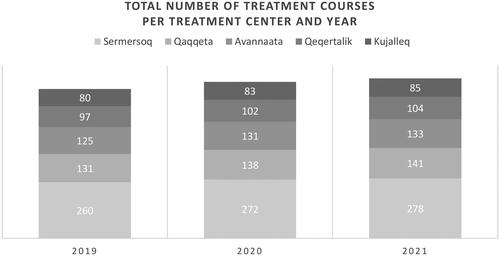
Table 1. Distribution of the number of patients and median age and weeks in treatment per year.
Figure 2. Quarterly development in documentation for each treatment center with the 2020 guideline update marked with the dashed line.
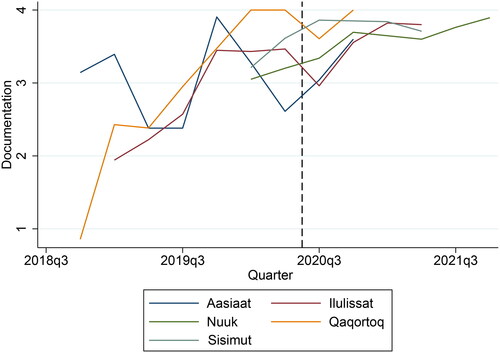
Figure 3. Quarterly development in content for each treatment center with the 2020 guideline update marked with the dashed line.
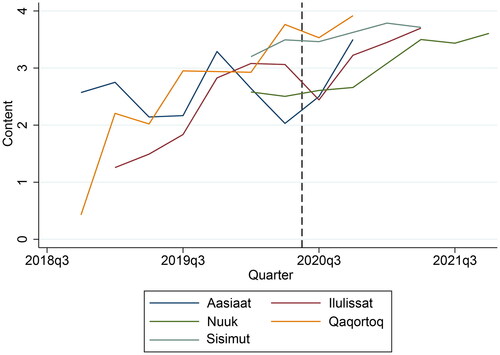
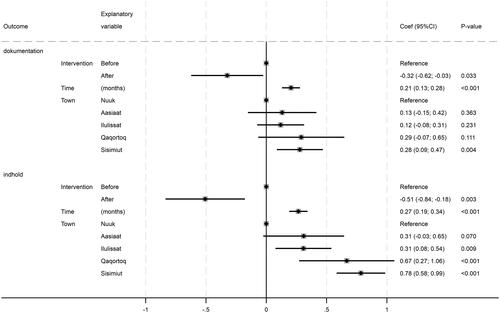
Figure 4. Forest plot of results from a mixed linear regression illustrating the development of quality in documentation and content and how time, treatment center, and the 2020 intervention (a new treatment guideline) have affected the quality development.
Data availability statement
Data management and -storage were handled by the Open Patient Data Explorative Network. The dataset can be shared upon request.