
Figures & data
Table 1. Demographic characteristics of study participants.
Figure 1. Responses to three closed questions by 112 residents in Psychiatry in Sweden.
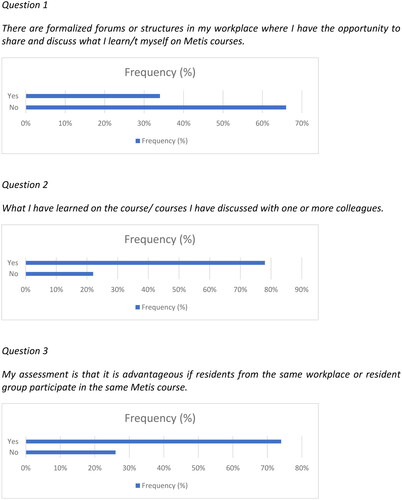
Table 2. Odds ratios for thinking it advantageous for residents from the same workplace or resident group to participate in the same course, by gender and age.
Table 3. Themes for collegial conversations.
Table 4. Themes for value of team participation.
Data availability statement
Due to the nature of the data this is not made publicly available.