
Figures & data
Table 1. Summary of study groups and inclusion criteria.
Figure 1. Protocol depicting the method used for quantifying the CVI in healthy myopic eyes. (a) binarized image designed to depict the intraretinal structure and choroidal layers in greater detail in a healthy, moderately highly myopic eye with an axial length of 27.8 mm. (a1) magnified image within the yellow square showing binarized processing of the subfoveal choroidal stroma and luminal vascular visualization of the subfoveal choroidal vessels to obtain a choroidal vascularity index (CVI) of 62.8% in a healthy, moderately myopic eye. The selected subfoveal area of choroidal flow is clearly delineated by the white dotted line. (a2) quantified choriocapillaris flow area (CFA) of 2.308 mm2 in the protocol-selected area of 3.142 mm2 in this healthy myopic eye. (b) binarized processing of choroidal flow in a healthy highly myopic eye with an axial length of 30.8 mm and enhanced choroidal vessel visualization, yielding a CVI of 59.4%. (b1) the magnified image within the white‒yellow dotted line clearly delineates a CVI of 1.972 mm2. (c) binarized image corresponding to a healthy, highly myopic eye in the control group; the CVI was 63.4% inside the selected choroidal flow area. (c1) magnified image depicting the selected area for the CVI measurements. The white and yellow dotted lines depict the binarized choroidal flow area selected to calculate the CVI. (c2) the CFA was 2.173 mm2 for the selected choriocapillaris. (d) binarized image in a healthy highly myopic eye with an axial length of 29.6 mm and a CVI of 58.2%. (d1) magnified image of the selected central subfoveal area clearly depicting the CVI area defined by the white dotted line. (d2) the CFA area was 1.737 mm2.
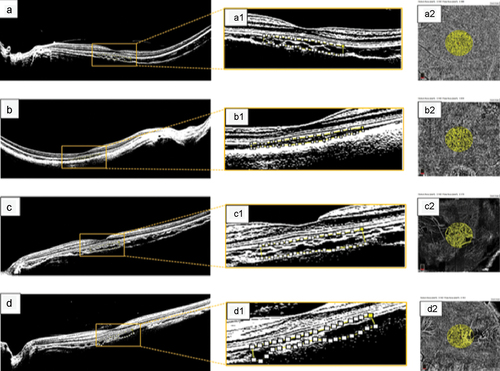
Table 2. Patient demographic data and clinical characteristics.
Table 3. BCVA and surgery characteristics.
Figure 2. OCT measurements across study groups. OCT imaging was used to obtain the choroidal vascularity index (CVI, a-b), choriocapillaris flow area (CFA, c-d), and central subfield thickness (CSFT, e-f). (a, c, e) measurements across the healthy myopia group and surgical group at baseline and final visits. For all three measurements, no significant differences were detected at baseline between the study groups, but values were lower in the surgical group at the final visit. (b, d, f) measurements across time series in the surgical group. Significant changes were detected across time in all three measurements. p values are indicated by * (ns = not significant, *** = p ≤ .001, **** = p ≤ .0001). CFA, choriocapillaris flow area; CSFT, central subfoveal thickness; CVI, choroidal vascularity index.
Table 4. Choroidal perfusion markers and OCT measurements for both study groups.
Figure 3. CVI measurements across MTM stages. The surgical group was separated based on the MTM stage. CVI at baseline (a), one month postsurgery (b), four months postsurgery (c), and the final visit (d) are plotted. p values are indicated by * (ns = not significant). CVI, choroidal vascularity index; MTM, myopic traction maculopathy.
Table 5. Multivariate linear model relating final postoperative BCVA with patient factors.
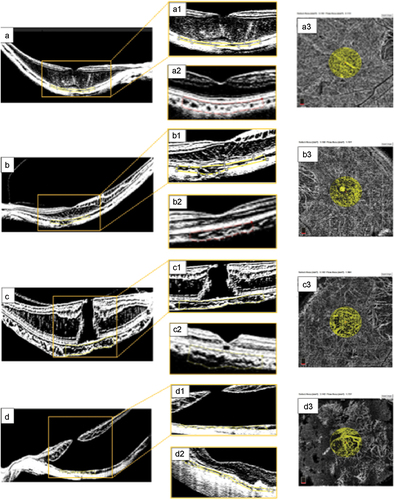
Figure 4. Surgical cases. (a) preoperative OCT findings consistent with myopic foveoschisis (FS) due to macular thickening and schisis-like thickening of the inner and outer retina layers. (a1) magnified image from the yellow inset depicting a preoperative choroidal vascularity index (CVI) of 49.8% calculated within the area clearly delineated with the yellow dotted line. (a2) long-term postoperative binarized image, showing a CVI of 47.3% within the area delineated with the red dotted line. (a3) the choriocapillaris flow area (CFA) was 2.308 mm2 at the selected subfoveal choriocapillaris area of 3.142 mm2. (b) preoperative image of a symptomatic female patient with FS and an axial length of 29.7 mm. (b1) corresponding binarized image of this complex FS eye with outer and inner retinal layer-like thickening, tractional elongation of Henle’s layer, and a thin superficial foveal layer with a preoperative CVI of 40.4%. (b2) long-term postoperative horizontal B-scan image following binarization showing an almost normal foveal profile, diffuse thinning of the retinal layers, and no evidence of outer or inner retinal layer thickening. The postoperative CVI was 49.6% in the subfoveal choroidal flow area, as delineated by the red dotted line. (b3) the image shows a CFA of 2.138 mm2 at the selected subfoveal choriocapillaris area of 3.142 mm2. (c) highly myopic eye with an axial length of 31.2 mm and a moderate posterior staphyloma. Evidence of a full-thickness myopic MH with tractional elongation of Henle’s layer and thickening of the macula without evidence of macular detachment. (c1) magnified preoperative binarized image with a CVI of 56.6%. (c2) postoperative structural evaluation showed a flat macula with a recovered foveal profile, an external limiting membrane (ELM) line lucency defect, and a well-preserved retinal pigment epithelium (RPE) layer. The calculated postoperative CVI was 54.4%. (c3) CFA of 1.808 mm2 at the selected subfoveal choriocapillaris area of 3.142 mm2. (d) preoperative image of an eye with extensive macular hole retinal detachment (MHRD). (d1) the preoperative CVI was 44.7%. (d2) postoperative appearance shows extrafoveal chorioretinal atrophic areas, an irregular foveal profile, a thin foveal roof, a closed macular hole, macular reattachment without evidence of residual subretinal fluid (SRF), attenuated internal and external retinal layers, and a subfoveal ellipsoid zone (EZ). The quantified choroidal perfusion indices were lower than those obtained in the control myopic group, with a CVI of 42.7%. (d3) the CFA value was 1.704 mm2 at the selected subfoveal choriocapillaris area of 3.142 mm2.
DATA AVAILABILITY STATEMENT
The datasets used in this study have been included in the main text. Photographs and figures from this study may be released via a written application to the Photographic Laboratory and Clinical Archives Retina Department at the Oftalmologia Integral ABC, Medical and Surgical Assistance Institution (Nonprofit Organization), Av. Paseo de las Palmas 735 suite 303, Lomas de Chapultepec, Mexico City 11,000, Mexico and the corresponding author upon request. The data analysis can be found in the supplementary file.