Figures & data
Figure 1. The schematic representation of the square steel slab with a circular copper intrusion (all dimensions are in meter).
Figure 2. Schematic representation of data collection.
Figure 3. A schematic representation of the grids for a particular position of the intrusion.
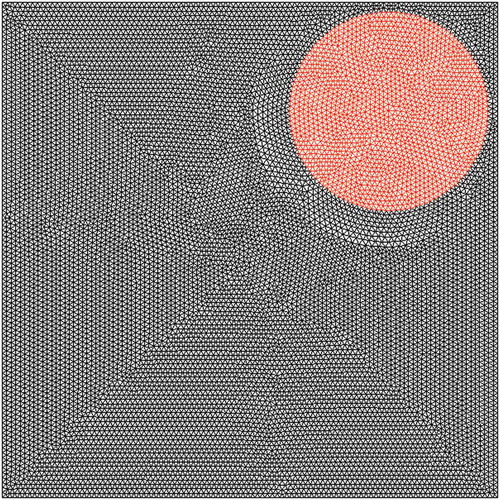
Figure 4. Plot of scaled energy residuals with iteration number.
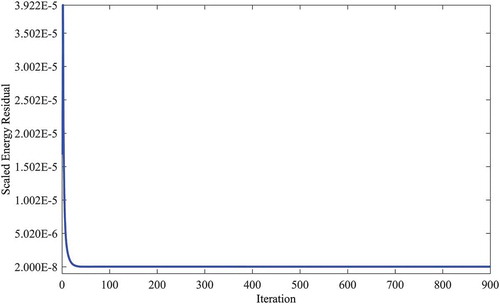
Figure 5. Schematic representation of the adopted multi-layer feed-forward NN.
Table
Figure 6. A schematic showing the proposed GA-tuned NN methodology (approach 2).
Figure 7. Temperature profile at the bottom wall of the square slab for different grid sizes (center of the intrusion is placed at the center of the slab; r = 0.2 m).
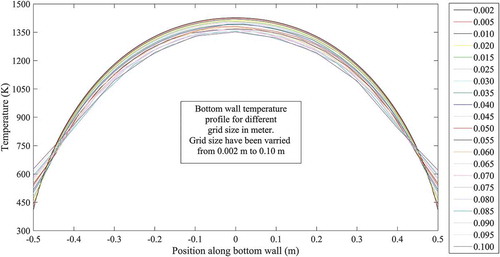
Figure 8. Variations of maximum temperature at bottom wall with grid size (position of the center of the intrusion is chosen at the center of the slab; radius of the intrusion is 0.2 m).
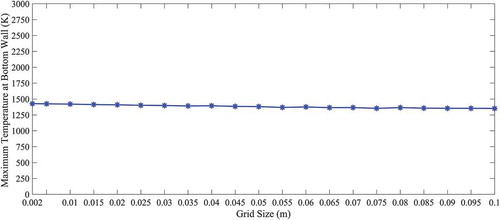
Figure 9. Temperature profiles at the bottom wall of the square slab for seven different positions of the circular intrusion with radius 0.2 m.
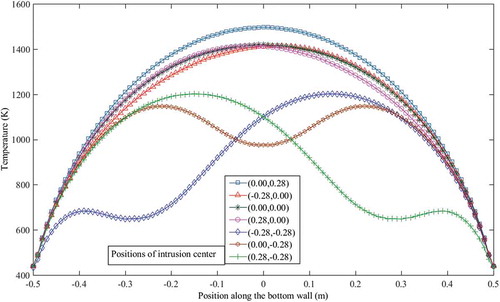
Figure 10. Variations of prediction error (%) with learning rate keeping other parameters fixed.
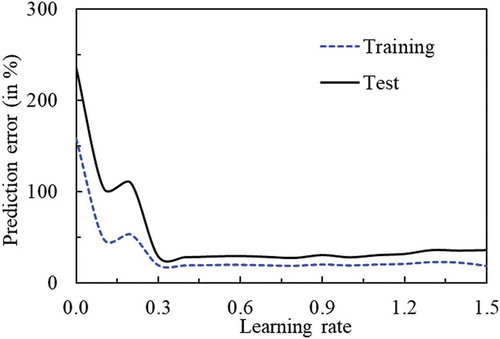
Figure 11. Distribution of test errors in prediction along the line x = 0 using approach 1.
Figure 12. Validations by comparing the bottom-wall temperature profile when intrusion is in the exact position with that when intrusion is in the predicted (using approach 1) position.
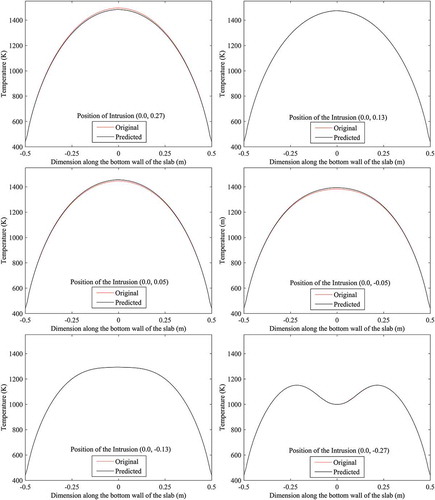
Figure 13. Validation/test in terms of plots between the temperatures along bottom wall with predicted (using approach 1) and exact position of the intrusion (along x = 0.0).
Figure 14. Validation/test in terms of comparison between the temperature contours with exact and predicted (through approach 1) position of the intrusion (along x = 0.0).
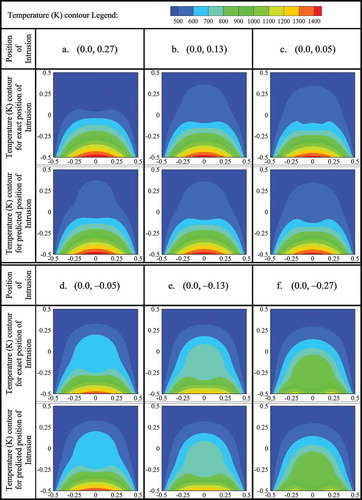
Table 1. Test errors in prediction (%) for different regions of the bulk using approach 2.
Figure 15. GA-fitness (% error in prediction) versus maximum number of generations.
Figure 16. Variation of NN training error (in percent) with the number of iterations of BP algorithm during weights updation/optimization.
Figure 17. Distribution of test errors in prediction in different regions of the bulk using approach 2.
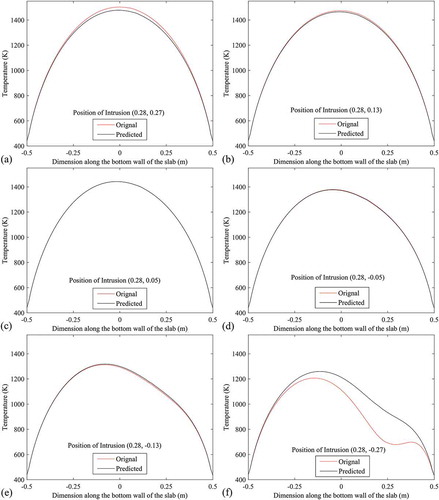
Figure 18. Validation/test in terms of comparisons between the temperature profiles at bottom wall with exact and predicted (through approach 2) position of the intrusion (along x = –0.28).
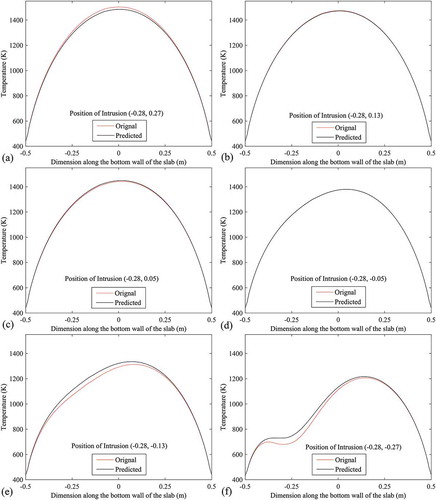
Figure 19. Validation/test in terms of plots between the temperatures along bottom wall with predicted (using approach 2) and exact position of the intrusion (along x = –0.14).
Figure 20. Validation/test in terms of comparison between the temperature contours with exact and predicted (through approach 2) position of the intrusion (along x = –0.06).
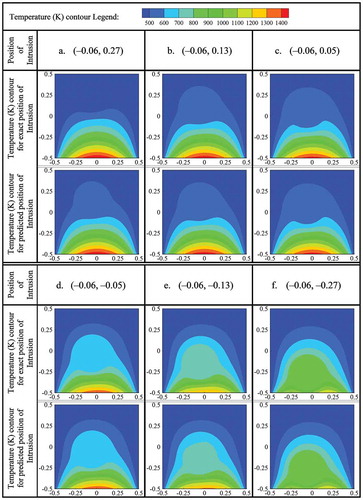
Figure 21. Validation/test in terms of plots between the temperatures along bottom wall with predicted (using approach 2) and exact position of the intrusion (along x = 0.0).

Figure 22. Validation/test in terms of comparisons between the temperature profiles at bottom wall with exact and predicted (using approach 2) positions of the intrusion (along x = 0.06).
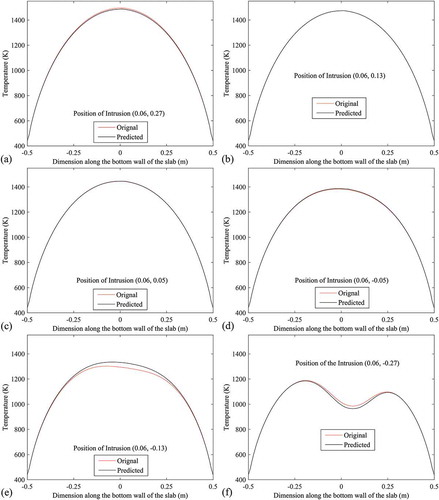
Figure 23. Validation/test in terms of comparisons between the temperature contours with actual and predicted (using approach 2) positions of the intrusion (along x = 0.14).
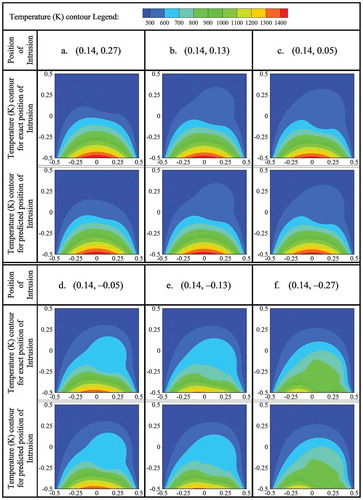
Figure 24. Validation/test in terms of comparisons between the temperature profiles at bottom wall with actual and predicted (using approach 2) positions of the intrusion (along x = 0.28).