Figures & data
Table 1. Primer sequences for KIM-1, NGAL, TGF-β, collagen-1, and β-actin.
Table 2. Effect of LG on STZ-induced alterations in body weight, blood glucose level, food intake, water intake, urine output, and relative kidney weight in diabetic rats.
Table 3. Effect of LG on STZ-induced alterations in serum and urine biochemical parameters in diabetic rats.
Table 4. Effect of LG on STZ-induced alterations in renal oxidonitrosative stress and hydroxyproline level in diabetic rats.
Figure 1. (A) Effect of LG on STZ-induced alterations in renal KIM-1, NGAL, TGF-β, and Collagen-1 mRNA expression in diabetic rats. (B) Quantitative representation of the mRNA expression of KIM-1, (C) NGAL, (D) TGF-β, and (E) Collagen-1. Results are represented as mean ± SEM, (n = 4) data were analyzed by One-way ANOVA followed by Tukey’s multiple range test for each parameter separately. #p < .05 as compared with normal group, *p < .05 as compared with diabetic control (DC) group and $p < .05 as compared with each other. N: normal group; DC: diabetic control group; Sita (5): sitagliptin (5 mg/kg, p.o.)-treated group; LG (250): L-glutamine (250 mg/kg, p.o.)-treated group; LG (500): L-glutamine (500 mg/kg, p.o.)-treated group; LG (1000): L-glutamine (1000 mg/kg, p.o.)-treated group. Lane 1: Ladder 1000 bp; Lane 2: mRNA expression of normal group; Lane 3: mRNA expression of diabetic control group; Lane 4: mRNA expression of sitagliptin (5 mg/kg, p.o.) treated group; Lane 5: mRNA expression of L-glutamine (250 mg/kg, p.o.) treated group; Lane 5: mRNA expression of L-glutamine (500 mg/kg, p.o.) treated group; Lane 7: mRNA expression of L-glutamine (1000 mg/kg, p.o.) treated group and Lane 8: mRNA expression of per se group.
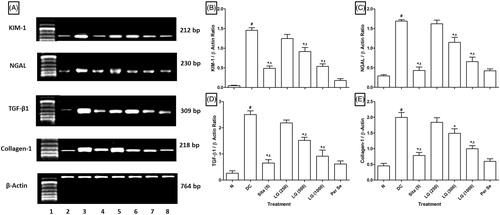
Figure 2. (A) Correlation analysis between blood glucose level and KIM-1, (B) NGAL, (C) TGF-β as well as (D) Collagen-1 mRNA expression in diabetic rats.
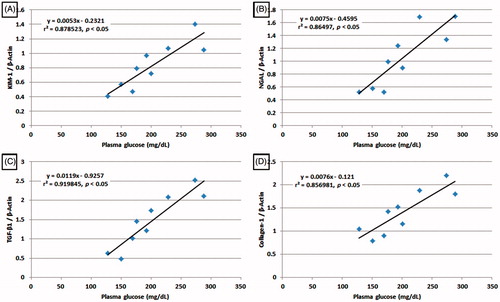
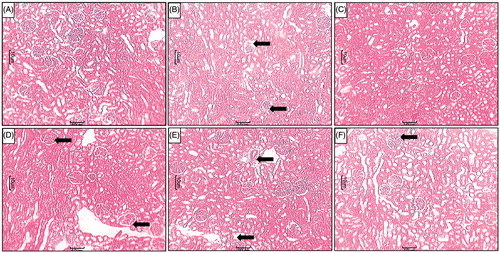
Figure 3. Effect of LG on STZ-induced alterations in kidney histology. Photomicrograph of sections of kidney of (A) normal, (B) diabetic control rats, (C) Sitagliptin (5 mg/kg, p.o.) treated rats (C), LG (250 mg/kg, p.o.) treated rats (D), LG (500 mg/kg, p.o.) treated rats (E) and LG (1000 mg/kg, p.o.) treated rats. H & E staining at 100×. Increase in thickening of the basement membrane (black arrow), necrosis (white arrow) and inflammatory infiltration (red arrow).
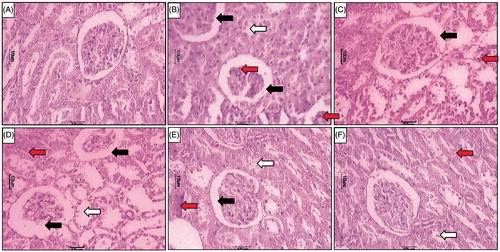
Figure 4. Effect of LG on STZ-induced alterations in kidney histology. Photomicrograph of sections of kidney of (A) normal, (B) diabetic control rats, (C) Sitagliptin (5 mg/kg, p.o.) treated rats (C), LG (250 mg/kg, p.o.)-treated rats (D), LG (500 mg/kg, p.o.)-treated rats (E) and LG (1000 mg/kg, p.o.)-treated rats. MT staining at 40×. Fibrosis (Black arrow).