
Figures & data
Table 1. Patient characteristics and baseline information.
Table 2. Correlation coefficients of LTI and FTI with serum and anthropometric parameters.
Table 3. Agreement between LTI and SGA regarding the presence of malnutrition.
Figure 1. The Kaplan–Meier survival curves showing 30-month survival for patients in low and normal lean tissue index (LTI) groups. In patients in the low LTI group, mortality increased (n = 123; log-rank χ2=12.11; p=.001).
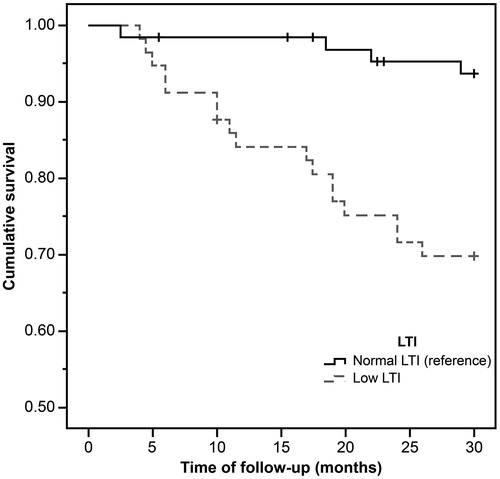
Figure 2. The Kaplan–Meier survival curves showing 30-month survival for patients in low and normal serum albumin group. In patients in the low serum albumin group, mortality increased (n = 123; log-rank χ2=6.42; p=.01).
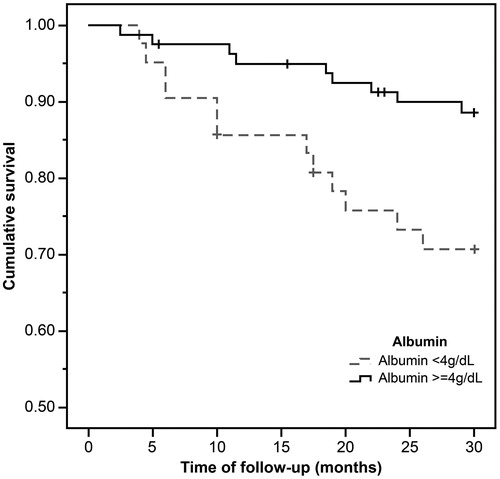
Figure 3. The Kaplan–Meier survival curves showing 30-month survival for patients diagnosed as normal and malnourished by SGA. In patients in the malnutrition group, mortality increased (n = 123; log-rank χ2=4.05; p=.04).
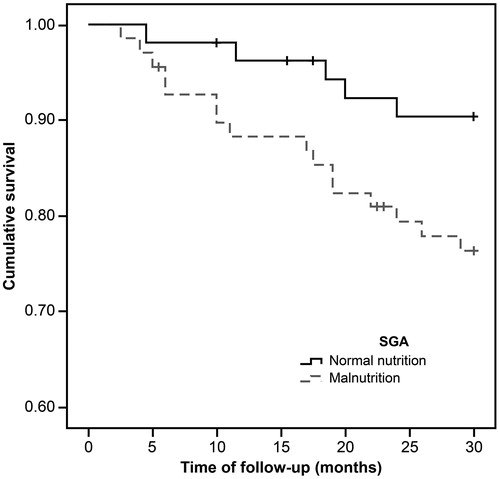
Table 4. Predictors of mortality derived from the Cox regression.