
Figures & data
Table 1. The primer sequences used for RT-PCR.
Figure 1. Changes in the viability of HK-2 cells were assessed after the HR treatment and BB-94 intervention using CCK-8 kits. All experiments were repeated three times, and the mean values are presented and compared (*p < .05).
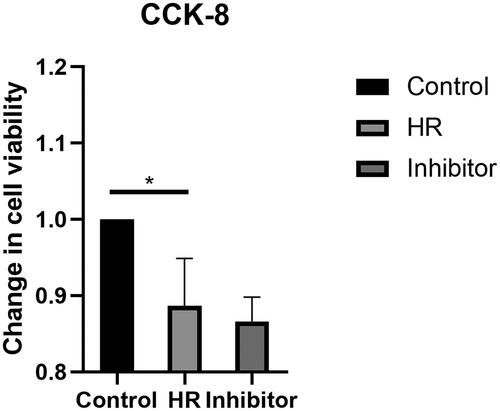
Figure 2. Relative fluorescence intensity and ratio of ROS + HK-2 cells. (A) Fluorescence images of HK-2 cells captured using a fluorescence microscope. (B) Quantitative analysis of the relative fluorescence intensity. (C) Flow cytometry plots of HK-2 cells. (D) Quantitative flow cytometry data. All experiments were repeated three times, and the mean values are presented and compared (**p < .01 and ***p < .005).
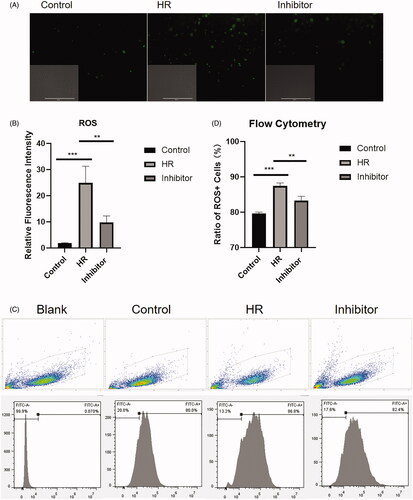
Figure 3. Levels of the MMP-2, MMP-9, and TIMP-1 mRNAs in HK-2 cells. (A) Real-time PCR analysis of levels of the MMP-2 mRNA in HK-2 cells. (B) Levels of the MMP-9 mRNA in HK-2 cells. (C) Levels of the TIMP-1 mRNA in HK-2 cells. All experiments were repeated three times, and the mean values are presented and compared (*p < .05; **p < .005; and ****p < .001).
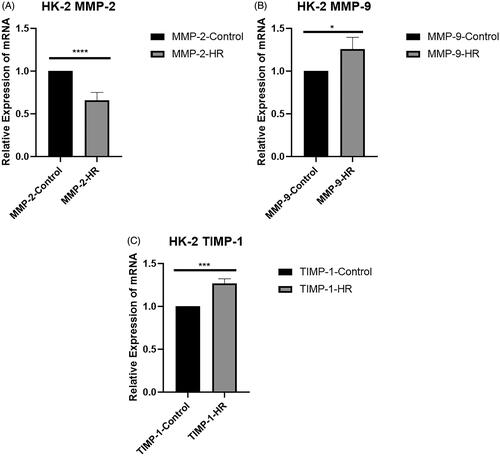
Figure 4. Levels of the MMP-9 and MMP-2 proteins in HK-2 cells. (A) Western blot analysis of MMP-2 protein levels. (B) Quantitation of the Western blot analysis of MMP-2 protein levels. (C) Western blot analysis of MMP-9 protein levels. (D) Quantitation of the Western blot analysis of MMP-9 protein levels. All experiments were repeated three times, and the mean values are presented and compared (*p < .05).
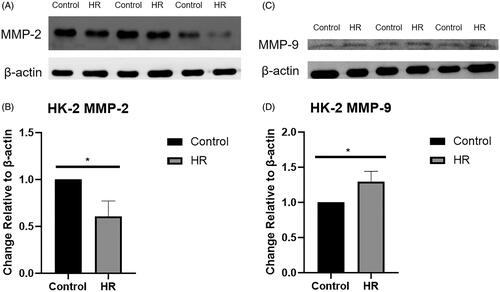
Figure 5. Levels of the CD-11b, CD-18, and MMP-9 mRNAs in PMNs. (A) Real-time PCR analysis of levels of the CD-11b mRNA in PMNs. (B) Levels of the CD-18 mRNA in PMNs. (C) Levels of the MMP-9 mRNA in PMNs. All experiments were repeated three times, and the mean values are presented and compared (*p < .05 and **p < .01).
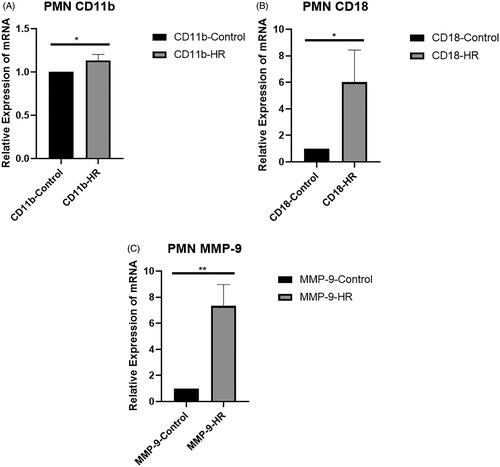
Figure 6. Levels of the MMP-9 protein in PMNs. (A) Western blot analysis of MMP-9 protein levels. (B) Quantitation of the Western blot analysis of MMP-9 protein levels. All experiments were repeated three times, and the mean values are presented and compared (*p < .05).
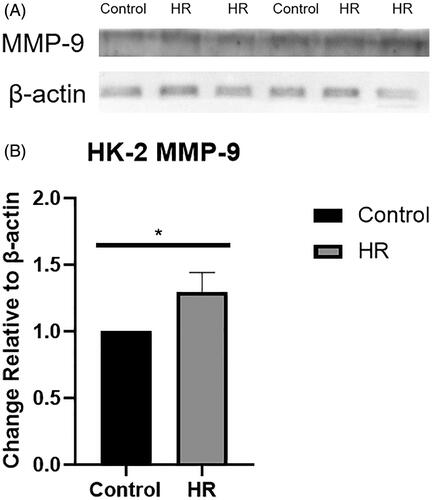
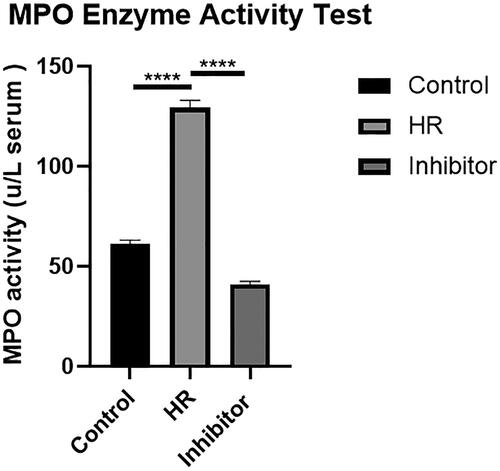
Figure 7. Effects of HK-2 cell supernatants on PMN MPO activity. All experiments were repeated three times, and the mean values are presented and compared (****p < .001).
Supplemental Material
Download PDF (78.7 KB)Supplemental Material
Download PDF (132.8 KB)Data availability statement
The data used to support the findings of this study are included in the article.