
Figures & data
Figure 1. Body weight changes during 1-year follow-up.
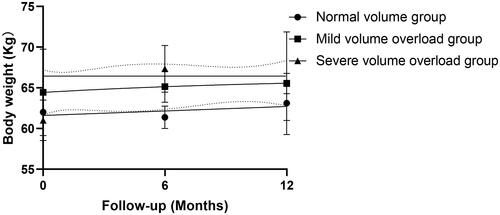
Table 1. Clinical data at baseline in different volume groups (N = 175).
Figure 2. Linear regression for the association between OH values and BPV of SBP% (A) and DBP% (B).
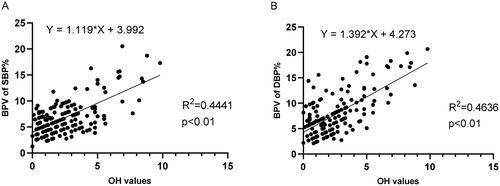
Table 2. Comparation of blood pressure and variability in different groups.
Table 3. Peritoneal dialysis related parameters and medications(N = 175).
Table 4. Parameters related to BPV in different volume groups.
Table 5. Multivariate linear regression of BPV associated parameters.
Data availability statement
Derived data supporting the findings of this study are available from the corresponding author [HR] on request.