
Figures & data
Table 1. Baseline characteristics of HD patients.
Table 2. The distribution of primary causes of death.
Table 3. Logistics regression of ERI.
Figure 1. The proportional hazard regression (PHREG) curve of survival probability between high ERI and low ERI group. The shadow area was the 95% confidence interval. (a) all-cause mortality; (b) cardiovascular mortality.
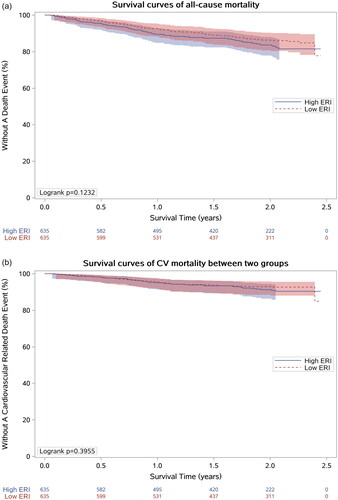
Figure 2. Cox regression analysis for ERI and all-cause mortality (a) or CV mortality (b). Model 1 was a crude model. Model 2: model 1 + age, gender, BMI, dialysis vintage, primary kidney disease. Model 3: model 2 + modified Charleson Comorbidity Index, fistula use. Model 4: model 3 + albumin (Alb), standardized kt/v.
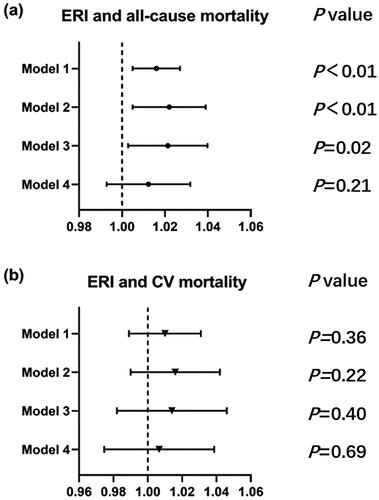
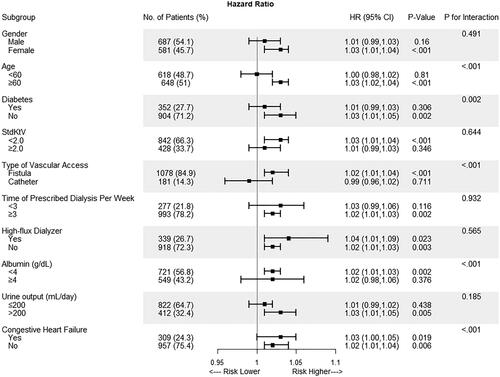
Figure 3. Subgroup analyses by gender (male vs. female), age (<60 vs. ≥60 years), diabetes, stdkt/v (<2 vs. ≥2), type of vascular access (fistula vs. catheter), time of prescribed dialysis per week (<3 vs. ≥3), high flux dialyzer, albumin (<4 vs. ≥4 g/dL), urine output (<200 vs. ≥200 mL/day), and congestive heart failure using cox regression. The model was adjusted for age, gender, BMI, vintage, and primary kidney disease.
Data availability statement
The data used in this study are available from the corresponding author on reasonable request.