
Figures & data
Figure 1. Flow chart of the screening process for the selection of eligible participants.
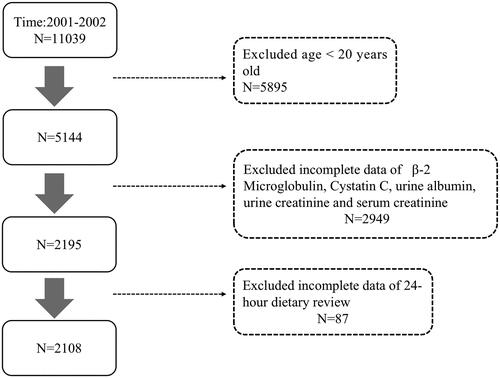
Table 1. Characteristics of participants aged 20 years and older from the NHANES (2001-2002).
Table 2. The linear relationship between DII and early renal injury indicators among participants aged 20 years and older from the NHANES (2001–2002).
Table 3. The logistic regression model between DII and the abnormality of early renal injury indicators among participants aged 20 years and older from the NHANES (2001–2002).
Table 4. The logistic regression model between hypertension status and the abnormality of early renal injury indicators among participants aged 20 years and older from the NHANES (2001–2002).
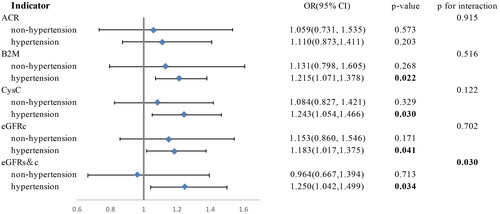
Figure 2. The relationship between DII and abnormality of early renal injury indicators differed by hypertension status among participants aged 20 years and older from the NHANES (2001–2002). Model was adjusted for covariates including gender, age, race, education level, poverty index, hypertension, diabetes, smoking, and drinking. Sampling weights were considered in logistic regression analyses to obtain nationally representative estimates.
Supplemental Material
Download PDF (223.9 KB)Data availability statement
All data can be downloaded from the NHANES website (https://www.cdc.gov/nchs/nhanes/about_nhanes.htm).