
Figures & data
Figure 1. The flowchart of patient screening.
T2DKD: type 2 diabetic kidney disease; EMR: electronic medical records; GN: glomerulonephritis; 24hUP: 24-h proteinuria; eGFR: estimated glomerular filtration rate; TwHF: Tripterygium wilfordii Hook F.
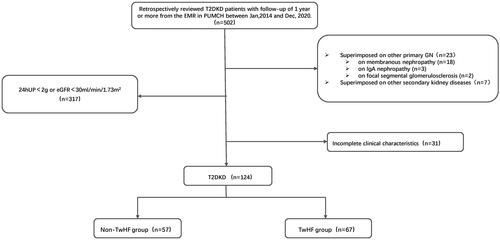
Table 1. The baseline characteristics of the TwHF and non-TwHF groups.
Table 2. The characteristics of the TwHF and non-TwHF groups at the end of the follow-up period.
Table 3. The univariate and multivariate Cox regression analysis for renal outcomes.
Figure 2. Kaplan-Meier curves for the renal outcomes in the overall cohort.
The renal outcomes were defined as doubling serum creatinine level or ESKD (dialysis or renal transplant), whichever occurred first. The non-TwHF group has a significantly lower proportion of patients without renal outcomes than the TwHF group (p = 0.0018). TwHF, Tripterygium wilfordii Hook F.
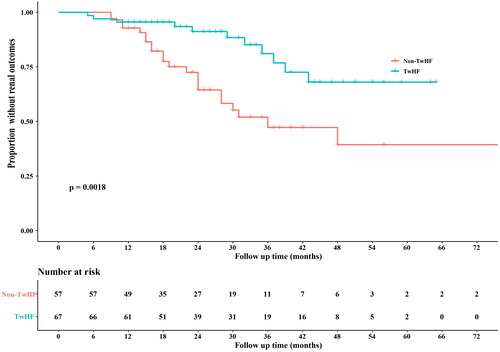
Figure 3. Comparison of the proportion of patients without renal outcomes between the two groups at three years using the restricted mean survival time method.
The pink part indicates RMST, and the orange part indicates RMTL. The y-axis denotes the proportion of patients without an outcome, and the x-axis shows the number of months. Abbreviations: RMST, restricted mean survival time; RMTL, restricted mean time lost.
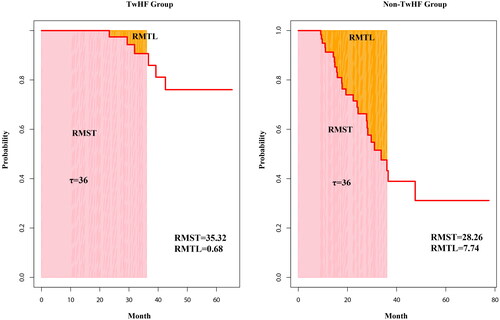
Table 4. Multivariate Cox regression analysis of renal outcomes in two subgroups according to TwHF use.
Table 5. Adverse events of TwHF during the follow-up period.
Supplemental Material
Download MS Word (205.4 KB)Supplemental Material
Download JPEG Image (2.1 MB)
Data availability statement
Research data are not shared due to privacy restrictions.