
Figures & data
Figure 1. Results of the pathological and NanoString analyses. (a) Representative images of Masson’s trichrome stained kidneys. Scale bar, 50 μm. (b) The volcano plots of the DEGs in DN. (c) The volcano plots of the DEGs in IgAN. (d) The volcano plots of the DEGs in MN. (e) The venn plot of the DEGs.
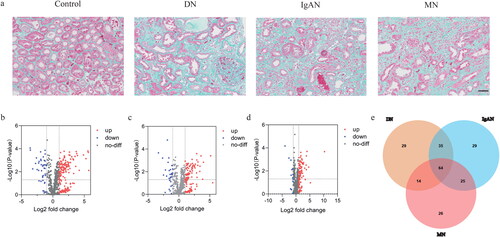
Table 1. qPCR Primer sequences.
Table 2. Demographic, clinical and laboratory features of study subjectsTable Footnote*.
Figure 2. GO and KEGG pathway enrichment analysis of the DEGs. (a) GO result of the 64 common DEGs. (b) GO result of the 29 DN-specific DEGs. (c) GO result of the 29 IgAN-specific DEGs. (d) GO result of the 26 MN-specific DEGs. (e) KEGG result of the 64 common DEGs. (f) KEGG result of the 29 DN-specific DEGs. (g) GO result of the 29 IgAN-specific DEGs. (H) KEGG result of the 26 MN-specific DEGs.
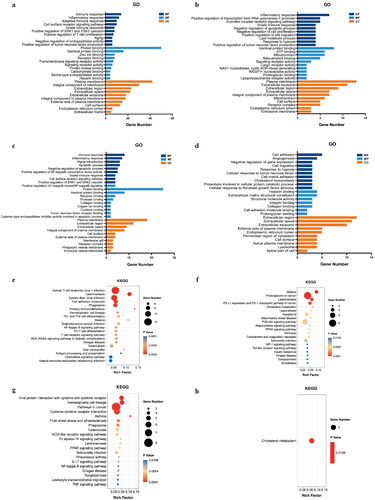
Figure 3. PPI network analysis of the DEGs. (a) PPI network of the 64 common DEGs. (b) PPI network of the 29 DN-specific DEGs. (c) PPI network of the 29 IgAN-specific DEGs. (d) PPI network of the 26 MN-specific DEGs.
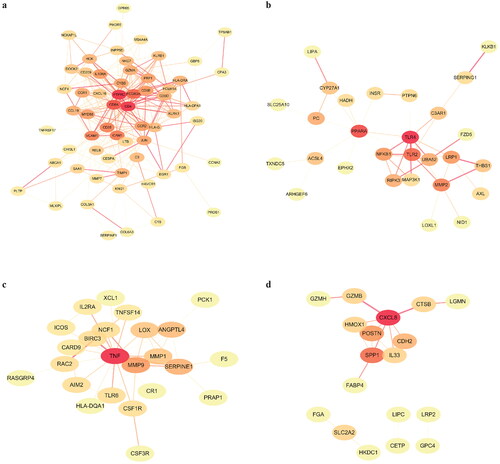
Figure 4. Validation of the key DEGs in the Nephroseq database. (a) Expression of PTPRC in CKD tissues and the normal controls. (b) Expression of ICAM1 in CKD tissues and the normal controls. (c) Expression of VCAM1 in CKD tissues and the normal controls. (d) Expression of IL10RA in CKD tissues and the normal controls. (e) Expression of CCR2 in CKD tissues and the normal controls. (f) Expression of PPARA in DN tissues and the normal controls. (g) Expression of SPP1 in MN tissues and the normal controls. (h) Expression of LOX in IgAN tissues and the normal controls. *p < 0.05, **p < 0.01, ***p < 0.001.
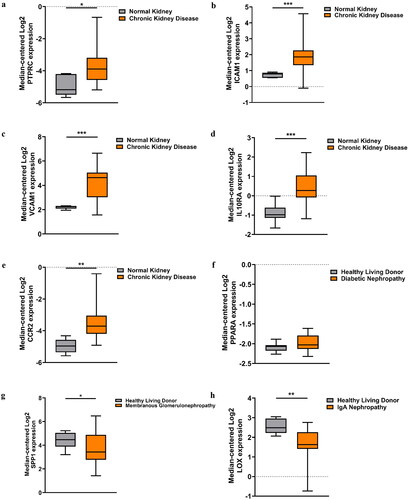
Figure 5. Correlation between the expression of hub genes and GFR in different types of CKD patients. (a) Correlation between PTPRC and GFR in DN patients. (b) Correlation between PTPRC and GFR in IgAN patients. (c) Correlation between PTPRC and GFR in MN patients. (d) Correlation between ICAM1 and GFR in DN patients. (e) Correlation between ICAM1 and GFR in IgAN patients. (f) Correlation between VCAM1 and GFR in CKD patients. (g) Correlation between IL10RA and GFR in DN patients. (h) Correlation between IL10RA and GFR in IgAN patients. (i) Correlation between PPARA and GFR in DN patients. (j) Correlation between SPP1 and GFR in MN patients. X axis: Log2 GFR (MDRD) (ml/min/1.73m2); Y axis: Median-centered Log2 expression of the genes.
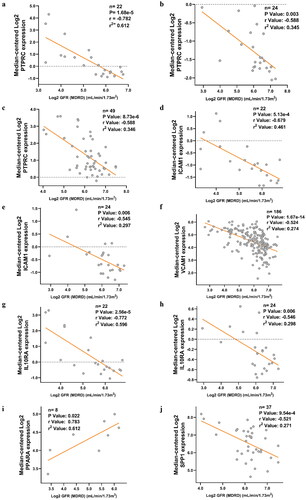
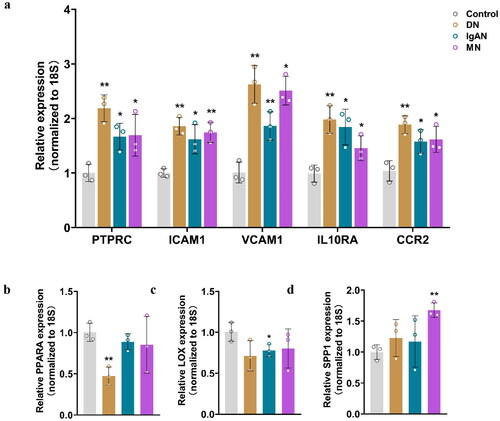
Figure 6. qRT-PCR analysis of the mRNA levels of the identified key genes in fibrotic CKD and normal tissues. (a) Relative expression of PTPRC, ICAM1, VCAM1, IL10RA and CCRA in DN, IgAN, MN and control groups. (b) Relative expression of PPARA in DN, IgAN, MN and control groups. (c) Relative expression of LOX in DN, IgAN, MN and control groups. (d) Relative expression of SPP1 in DN, IgAN, MN and control groups. n = 3. *p < 0.05, **p < 0.01. Student’s t-test was used for comparison between the groups.
Supplemental Material
Download PDF (138.8 KB)Data availability statement
The authors confirm that the data supporting the findings of this study are available within the article and its supplementary materials.