
Figures & data
Figure 1. Effects of canagliflozin on blood pressure, oxidative stress, and renal fibrosis. (A) Blood pressure; (B) Serum creatinine; (C) Urinary protein excretion; (D) Serum SOD activity; (E) Semi-quantification of fibrosis in the left kidney from the Masson trichrome-stained section; (F) Representative left renal sections stained by Masson trichrome staining; HSD, high-salt diet. *p < 0.05, **p < 0.01 vs. NSD. #p < 0.05, ##p < 0.01 vs. HSD.
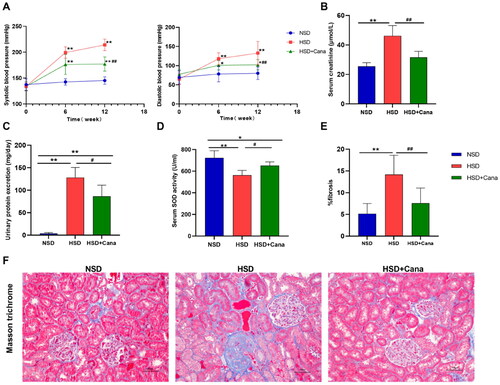
Figure 2. Effects of canagliflozin on gut microbiota community structure. (A) Chao1 indices and Simpson indices (p > 0.05); (B) Bray-Curtis distance based PCoA (p < 0.01); axis 1 and 2 represent the major axes of variation among objects in a two-dimensional space. HSD, high-salt diet.
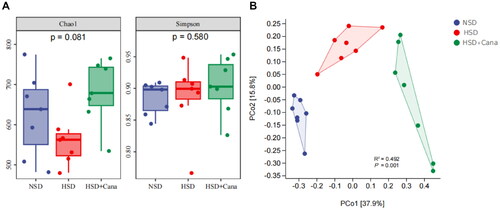
Figure 3. Canagliflozin-mediated changes of gut microbiota in HSD-fed DSS rats. (A) Average relative percentage abundance of top 10 phylume; (B) Average relative percentage abundance of top 10 genus; (C) Taxonomic cladogram generated from LEfSe analysis of 16S rRNA gene sequences. Each circles size is proportional to the taxon’s abundance. LEfSe analysis showed that these taxa were significantly more abundant in comparison to the other groups; (D) Genus with significant difference between the HSD and HSD + Cana group in metagenome Seq analysis. HSD, high-salt diet.
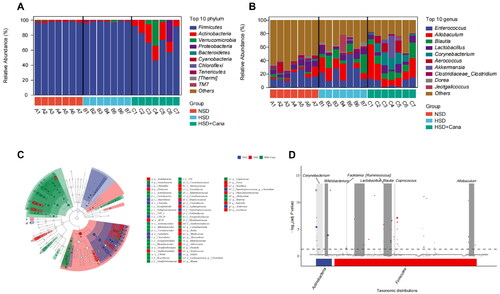
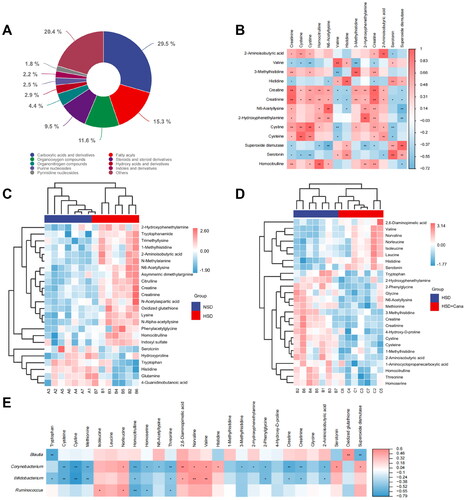
Figure 4. Canagliflozin alleviates kidney injury by regulating intestinal microorganisms to reduce urinary toxin concentration. (A) The proportion of all metabolites detected in three groups according to chemical classification; (B) Heatmaps of serum metabolites correlations in three groups; (C) Clustering heat map of metabolites with partial significant differences between NSD and HSD groups; (D) Clustering heat map of metabolites with partial significant differences between HSD and HSD + Cana groups; (E) Serum metabolites, gut microbiota, and their correlations. The heatmaps with gradient colors of blue, white, and red illustrate the Spearman correlations of the relative abundance of microbes and the concentrations of serum metabolites. The r values are represented by gradient colors, where red and blue cells indicate positive and negative correlations, respectively. *p < 0.05, **p < 0.01. HSD, high-salt diet.
Data availability
The data used to support the findings of this study are available from the corresponding author upon request.