
Figures & data
Table 1. Characteristics of patients with chronic kidney disease and healthy individuals.
Figure 1. Comparisons of the genotype frequency and allele frequency of SNPs in the TERT gene between the CKD case and healthy control groups. (a–d) Comparisons of the genotype frequencies of rs2736100, rs2853677, rs2735940, and rs4635969. (e–h) Comparisons of the allele frequencies of rs2736100, rs2853677, rs2735940, and rs4635969. ‘*’ indicates statistical significance at the 0.05 level.
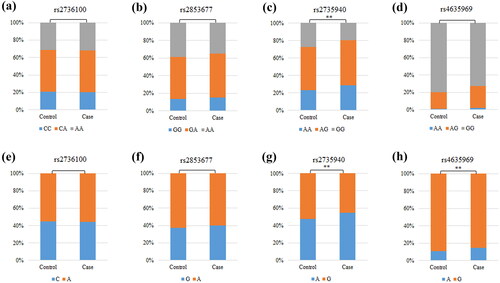
Table 2. The basic information and HWE about the selected SNPs.
Figure 2. Analysis of the association between susceptibility to CKD and SNPs. SNPs: single nucleotide polymorphisms; OR: odds ratio; CI: confidence interval; p values represent adjustment for age and gender; p < 0.05, bold text and ‘*’ indicate statistical significance.
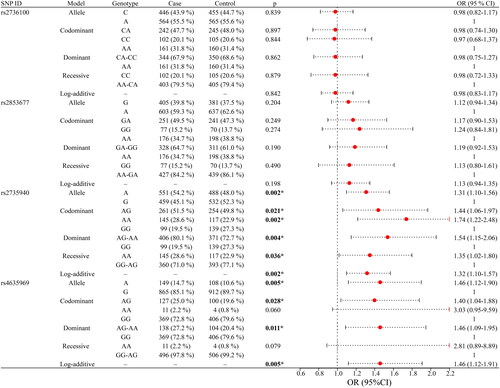
Table 3. The SNPs associated with susceptibility to chronic kidney disease in the subgroup tests (age and gender).
Figure 3. Dendrogram of SNP-SNP interactions. The colors in the tree diagram represent either synergy or redundancy.
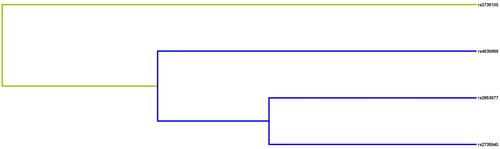
Table 4. SNP–SNP interaction models analyzed by the MDR method.
Table 5. Clinical characteristics of patients (N = 507) based on the genotypes of selected SNPs.
Supplemental Material
Download PDF (190.6 KB)Data availability statement
The original contributions or analyzed during this study are available from the article. Further inquiries can be made to the corresponding author.