
Figures & data
Figure 1. CXCR7 expression is downregulated in renal tubular cells.
(A) Graphical representations showing the relative abundance of CXCR7 mRNA in the UIRI mouse model. ***P < 0.001. n = 5. (B) Representative Western blots showing renal expression of CXCR7 and FN in the two groups, as indicated. (C-D) Graphical representations of (C) CXCR7 and (D) FN protein expression levels are shown. ***P < 0.001. n = 5. (E) Immunohistochemical staining showing the expression of CXCR7 in the UIRI mouse model. Arrows indicate positive staining. Scale bar, 50 μm. (F) Graphical representations showing the relative abundance of CXCR7 mRNA in the UUO mouse model. ***P < 0.001. n = 5. (G) Representative Western blots showing renal expression of CXCR7 and FN in UUO model mice, as indicated. (H-I) Graphical representations of (H) CXCR7 and (I) FN protein expression levels are shown. **P < 0.01. n = 5. (J) Immunohistochemical staining showing the expression of CXCR7 in UUO model mice. Arrows indicate positive staining. Scale bar, 50 μm.
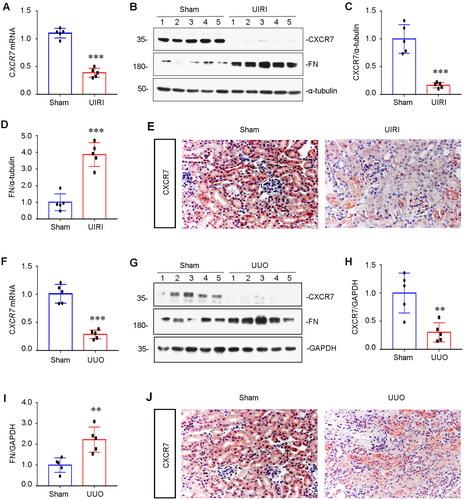
Figure 2. CXCR7 Is expressed mainly in renal tubule epithelial cells.
(A) Images of CXCR7 and various segment-specific tubular marker colocalization in the kidneys of sham mice. Frozen kidney sections (3 μm) were collected from the sham mice. CXCR7 (red) and three segment-specific tubular markers (green), namely, lotus tetragonolobus lectin (LTL), peanut agglutinin (PNA), and dolichos biflorus agglutinin (DBA), were detected by immunofluorescence. Scale bar, 50 μm. (B) Immunofluorescence staining for CXCR7 (red) and F4/80 (green) and DAPI staining were performed on the kidneys of UIRI mice. Scale bar, 50 μm. (C) Immunofluorescence staining of CXCR7 (green) and CD31 (red) was performed, and immunofluorescence was used to detect DAPI in the kidneys of the UIRI model mice. Scale bar, 50 μm.
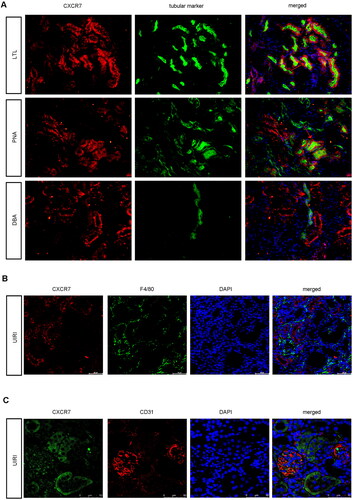
Figure 3. Overexpression of CXCR7 protects against renal dysfunction in vivo.
(A) Experimental design. The black arrows indicate the timing of renal UIRI surgery. Red arrows indicate the injection of pcDNA3 or the pFlag-CXCR7 plasmid via the tail vein. (B) Scr and (C) BUN levels in the three groups. ***P < 0.001. n = 5. (D) Graphical representations showing the relative abundance of CXCR7 mRNA in the three groups. (E) Protein expression levels of Flag and CXCR7; graphical representations showing the relative abundance of the CXCR7 protein in the three groups (F). *P < 0.05. n = 5. (G) Representative images showing CXCR7 (green) and PAS staining in the three groups. Boxed areas are enlarged in the bottom panels. Arrows indicate the injured tubules. Scale bar, 50 μm.
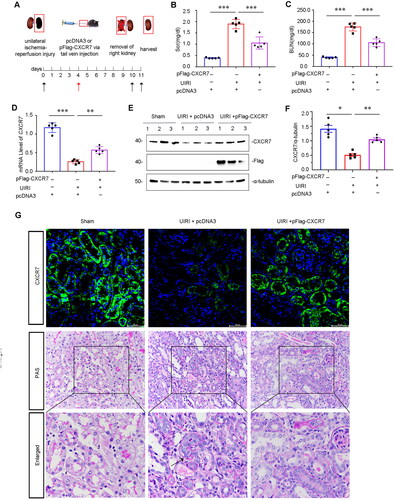
Figure 4. CXCR7 inhibits renal fibrosis through β-catenin signaling in the UIRI mouse model.
(A) Representative protein graphs and expression levels of (B) Collagen I, (C) FN, (D) E-cadherin, and (E) active β-catenin are shown. *P < 0.05, **P < 0.01, ***P < 0.001. n = 5. (F–G) Graphical representations showing the relative abundance of Collagen I and α-SMA mRNA in the three groups. **P < 0.01, ***P < 0.001. n = 3. (H) Representative micrographs showing Masson, Sirius Red pathological, FN and β-catenin immunohistochemical staining in the three groups, as indicated. Arrows indicate positive staining. Scale bar, 50 μm.
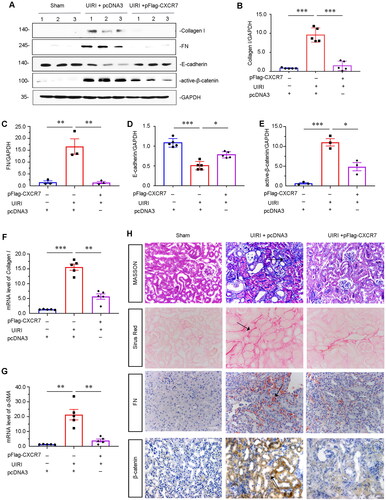
Figure 5. Overexpression of CXCR7 inhibits FN and β-catenin expression.
(A–D) Graphical representations showing the relative mRNA levels of CXCR7, α-SMA, FN and Collagen I versus those in the pcDNA3 group. *P < 0.05, ***P < 0.001. n = 3. (E) Representative micrographs of WB and quantitative statistical data showing the protein levels of (F) CXCR7, (G) FN and (H) β-catenin in each group. *P < 0.05, **P < 0.01. n = 3.
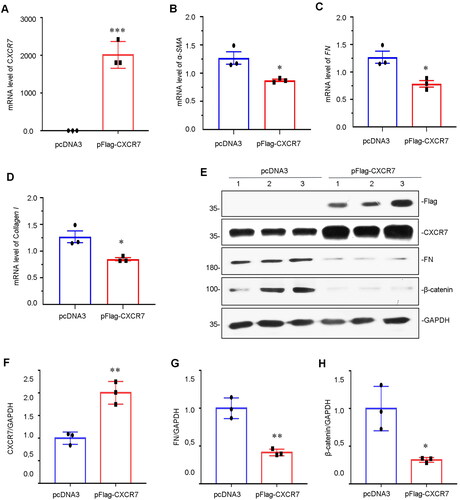
Figure 6. CXCR7 inhibits fibrogenesis in TGF-β1-treated tubular cells in vitro.
(A) Representative micrographs of WB and quantitative statistical data showing the protein levels of (B) α-SMA and (C) FN in each group. *P < 0.05, **P < 0.01. n = 3. (D–F) Graphical representations showing the relative mRNA levels of CXCR7, Collagen I and FN in the different groups. *P < 0.05, **P < 0.01, ***P < 0.001. n = 3. (G) Representative micrographs showing the protein expression level of FN in each group, as indicated. Frozen sections were stained with FN antibodies. Scale bar, 50 μm.
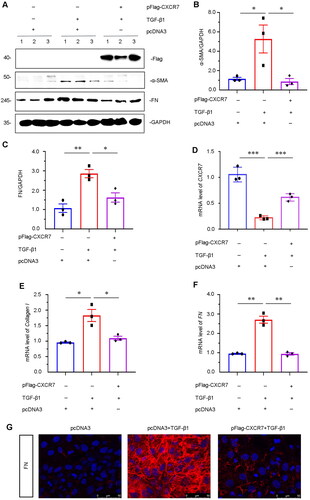
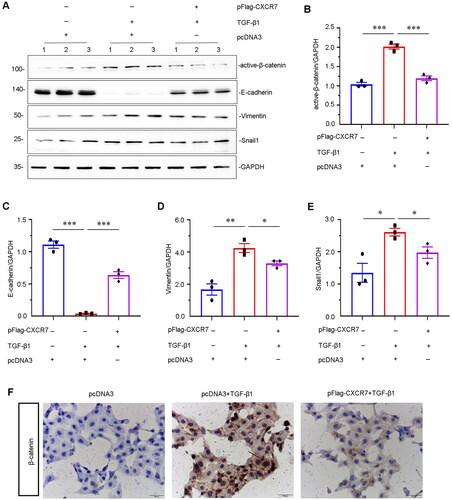
Figure 7. CXCR7 inhibits EMT and β-catenin signaling in TGF-β1-treated tubular cells in vitro.
(A) Representative micrographs of WB and quantitative statistical data showing the protein levels of (B) active β-catenin, (C) E-cadherin, (D) vimentin, and (E) Snail1 in each group. *P < 0.05, **P < 0.01, ***P < 0.001. n = 3. (F) Representative cell slime immunohistochemical staining showing the protein expression level of β-catenin in each group, as indicated. Arrows indicate positive staining. Scale bar, 50 μm.
Supplemental Material
Download JPEG Image (2.1 MB)
Supplemental Material
Download PDF (393.4 KB)Data availability statement
The raw data supporting the conclusions of this article will be made available by the authors without undue reservation.