
Figures & data
Figure 1. Study flow chart. PDW: platelet distribution width; ROC: receiver-operating characteristic curves.
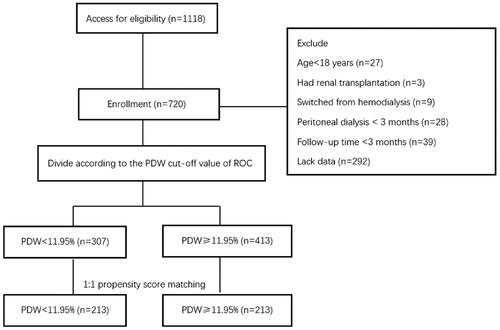
Figure 2. Receiver operating characteristic curve of PDW that predicted all-cause mortality. AUC: Area under the curve.
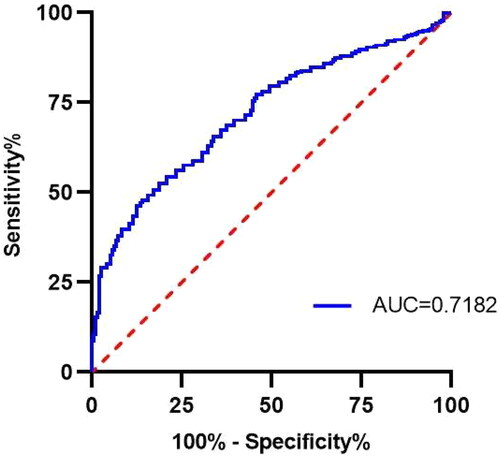
Table 1. Comparisons of baseline data between the two groups before PSM.
Table 2. Comparisons of baseline data between the two groups after PSM.
Figure 3. The Kaplan–Meier survival analysis for all-cause mortality after propensity score matching. PDW: platelet distribution width.
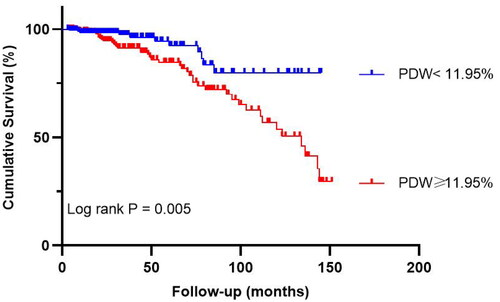
Figure 4. The Kaplan–Meier survival analysis for cardiovascular mortality after propensity score matching. PDW: platelet distribution width.
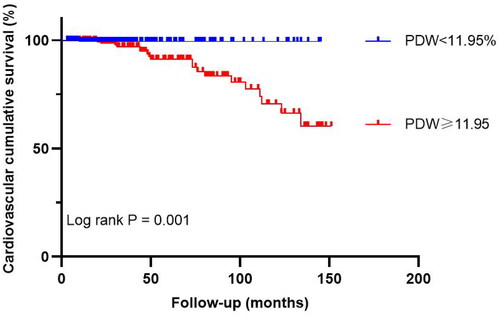
Table 3. Cox regression analysis of PDW in association with all-cause and cardiovascular mortality after propensity score matching.
Figure 5. Restricted cubic spline analyses of the relationship between PDW and all-cause mortality after propensity score matching. PDW: platelet distribution width.
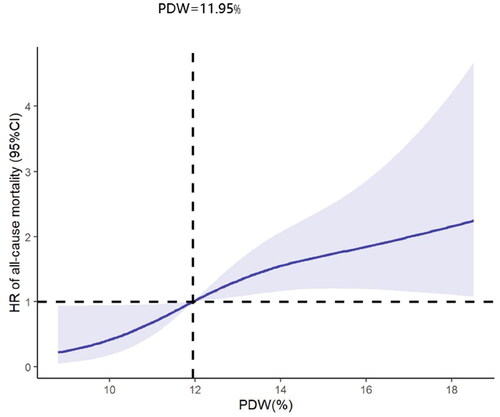
Figure 6. Restricted cubic spline analyses of the relationship between PDW and cardiovascular mortality after propensity score matching. PDW: platelet distribution width.
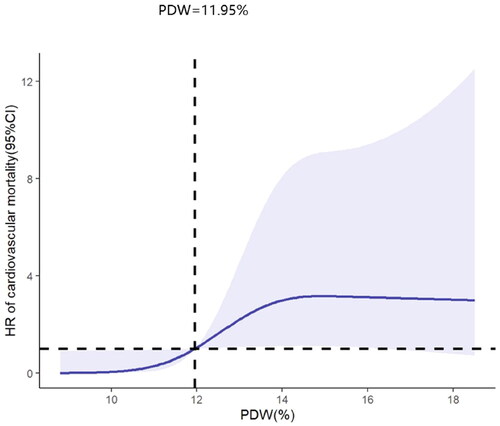
Figure 7. Correlation analysis of platelet counts and PDW after propensity score matching. PDW: platelet distribution width.
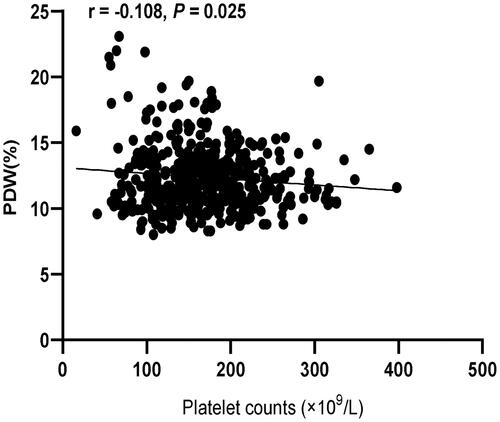
Table 4. Pearson correlation analysis of factors associated with PDW after propensity score matching.
Data availability statement
The datasets in this study are available from the corresponding author on reasonable request.