
Figures & data
Figure 1. The flow chart of this study. AKI: acute kidney injury; ICU: intensive care unit.
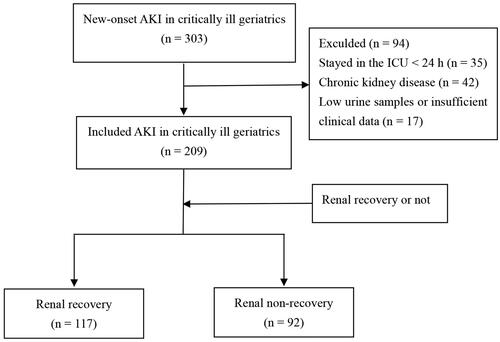
Table 1. Clinical characteristics of older adults with acute kidney injury in intensive care units.
Figure 2. Survival curve analysis stratified by renal recovery status.
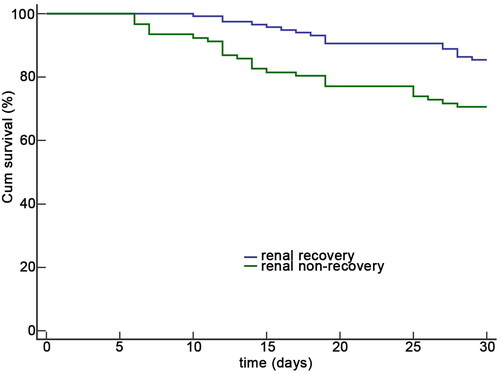
Table 2. Risk factors associated with renal non-recovery among participants.
Figure 3. The predictive value of urinary biomarkers and the associated model. The ROC curves of urinary [TIMP-2]*[IGFBP7] and the associated model for predicting renal non-recovery from AKI. The AUC of using urinary [TIMP-2]*[IGFBP7] only, clinical prediction model only, and the [TIMP-2]*[IGFBP7] combined with clinical prediction model. ROC: receiver operating characteristic; AUC: area under the ROC.
![Figure 3. The predictive value of urinary biomarkers and the associated model. The ROC curves of urinary [TIMP-2]*[IGFBP7] and the associated model for predicting renal non-recovery from AKI. The AUC of using urinary [TIMP-2]*[IGFBP7] only, clinical prediction model only, and the [TIMP-2]*[IGFBP7] combined with clinical prediction model. ROC: receiver operating characteristic; AUC: area under the ROC.](/cms/asset/5f6be0b9-8d17-4721-8369-11e824bf5aee/irnf_a_2304099_f0003_c.jpg)
Table 3. Biomarkers and combination models for predicting non-recovery from AKI.
Figure 4. The predictive value of biomarkers for 30-day mortality. The ROC curves of urinary [TIMP-2]*[IGFBP7] for predicting 30-day mortality after AKI. ROC: receiver operating characteristic; AUC: area under the ROC.
![Figure 4. The predictive value of biomarkers for 30-day mortality. The ROC curves of urinary [TIMP-2]*[IGFBP7] for predicting 30-day mortality after AKI. ROC: receiver operating characteristic; AUC: area under the ROC.](/cms/asset/726fee0c-a0d9-44f8-a1fe-d5feb260f792/irnf_a_2304099_f0004_c.jpg)
Figure 5. Kaplan-Meier survival curves according to the cutoff value. Survival analysis regarding 30-day mortality using the Kaplan-Meier technique according to the cutoff value. (a) Survival curves of participants with urinary [TIMP-2]*[IGFBP7] ≥ 0.81 and those with < 0.81. (b) Survival curves of participants with high urinary [TIMP-2]*[IGFBP7] and high clinical risk model (≥ 0.50) and those with low clinical risk (< 0.50).
![Figure 5. Kaplan-Meier survival curves according to the cutoff value. Survival analysis regarding 30-day mortality using the Kaplan-Meier technique according to the cutoff value. (a) Survival curves of participants with urinary [TIMP-2]*[IGFBP7] ≥ 0.81 and those with < 0.81. (b) Survival curves of participants with high urinary [TIMP-2]*[IGFBP7] and high clinical risk model (≥ 0.50) and those with low clinical risk (< 0.50).](/cms/asset/82458d81-7715-4962-b8fe-7ac4830af627/irnf_a_2304099_f0005_c.jpg)
Supplemental Material
Download PDF (144.9 KB)Data availability statement
All data generated and/or analyzed during this study are included in this published article.