Figures & data
Table 1. Baseline characteristics of the study participants according to the urinary protein/creatinine ratio (UPCR).
Table 2. Results of univariate analysis.
Figure 1. The prevalence rate of the study endpoints in the different UPCR groups. CVD: cardiovascular disease; UPCR: urinary protein/creatinine ratio.
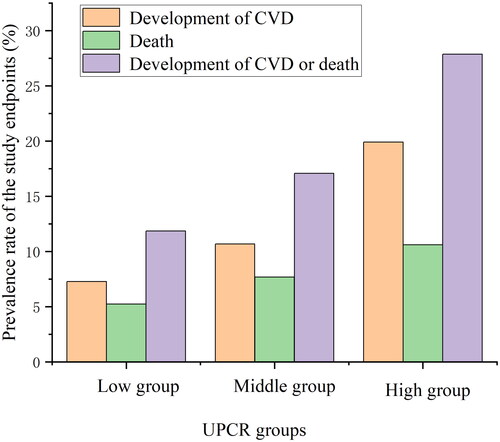
Table 3. Multivariable association of the urinary protein/creatinine ratio with the study endpoints.
Figure 2. A nonlinear relationship was observed between UPCR levels and the incidence of the primary outcome. The red line denotes fitted curves, and the blue line represents 95% confidence intervals for the association between UPCR and the primary outcome. Adjusted for sex, age, BMI, eGFR, hypertension, diabetes, the prevalence of CVD, and the use of RAASi.
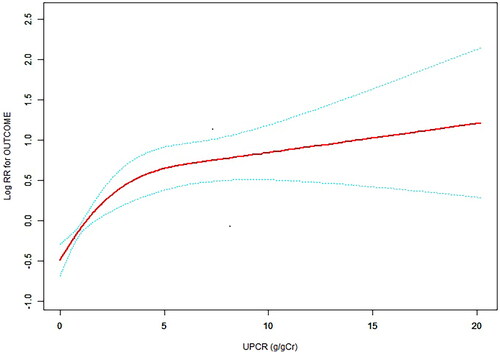
Figure 3. Multivariable-adjusted Kaplan–Meier plot for the association of the UPCR groups with the incidence of the primary outcome; Kaplan–Meier plot adjusted for sex, age, BMI, eGFR, hypertension, diabetes, the prevalence of CVD, and the use of RAASi.
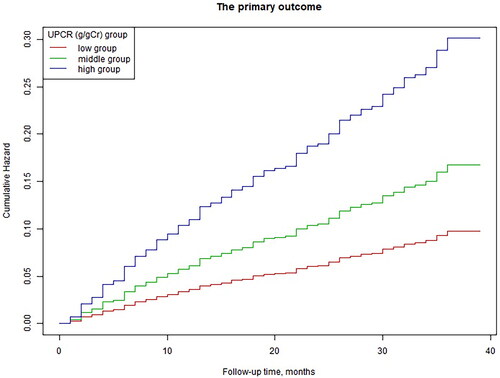
Table 4. The results of the two-piecewise linear regression model.
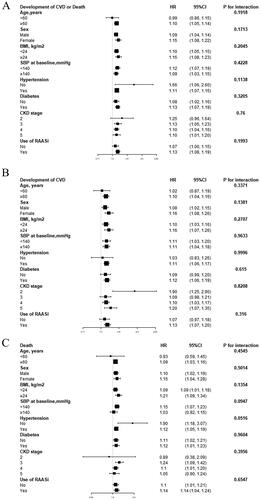
Figure 4. Subgroup analysis of UPCR and the study endpoints (A. Development of CVD or death; B. Development of CVD; C. Death). Adjusted for sex, age, BMI, eGFR, hypertension, diabetes, the prevalence of CVD, and the use of RAASi.