Figures & data
Figure 1. Effect of Mudan granules on weight, food intake, water consumption and blood glucose in diabetic rats. a: Body weight of rats. b: Food consumption. c: Water consumption. d: Fasting blood glucose. e: Random blood glucose. All data were expressed as mean ± SD, n = 5. Compared with the control group, #P < 0.05, ##P < 0.01. Compared with the diabetic model group, *P < 0.05, **P < 0.01.
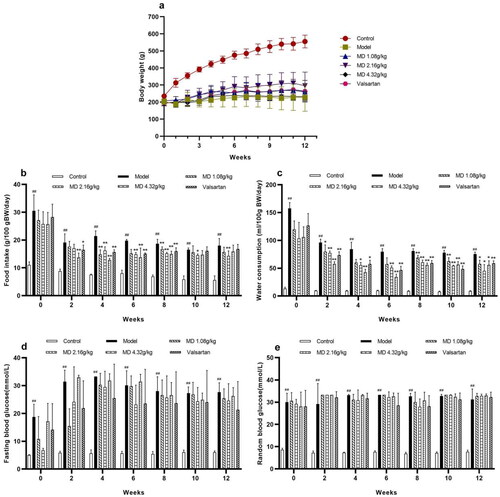
Figure 2. Effect of Mudan granules on the function of the kidney in diabetic rats. a: UACR. b: Serum creatinine. c: Blood urea nitrogen. All data were expressed as mean ± SD, n = 5. Compared with the control group, #P < 0.05, ##P < 0.01. Compared with the diabetic model group, *P < 0.05, **P < 0.01.
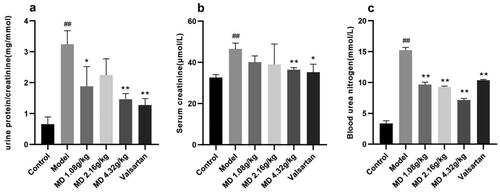
Table 1. The effect of Mudan granules on 24-h urinary protein and creatinine in diabetic rats.
Figure 3. Effect of Mudan granules on blood lipids in diabetic rats. a: High-density lipoprotein cholesterol. b: Low-density lipoprotein cholesterol. c: Total cholesterol. d: Triglyceride. All data were expressed as mean ± SD, n = 5. Compared with the control group, #P < 0.05, ##P < 0.01. Compared with the diabetic model group, *P < 0.05, **P < 0.01.
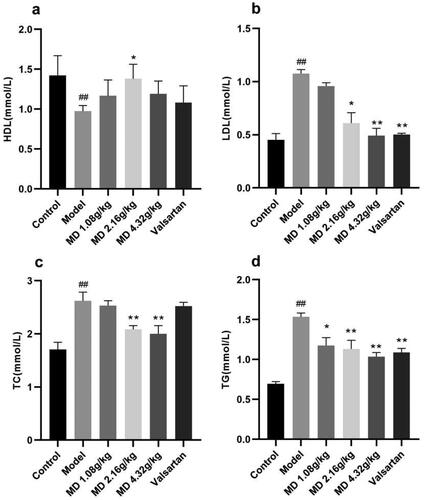
Figure 4. Effect of Mudan granules on the histomorphology of the kidney in diabetic rats (×400). a: HE staining. The black arrows point to fat vacuoles and irregular glomerular morphology. b: PAS staining. The black arrows point to fat vacuoles and glycogen deposition. c: Masson staining. The black arrows point to collagen fibers. d: Renal fibrosis area (%) in each group. All data were expressed as mean ± SD, n = 3. Compared with the control group, #P < 0.05, ##P < 0.01. Compared with the diabetic model group, *P < 0.05, **P < 0.01.
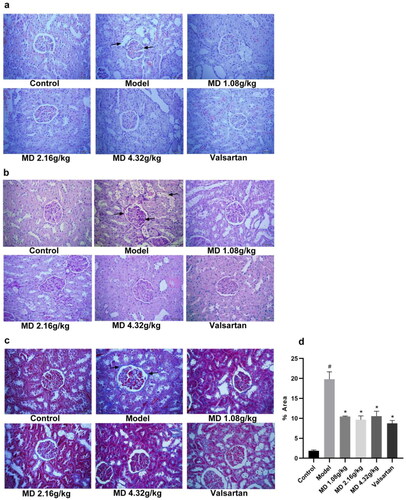
Figure 5. Effect of Mudan granules on serum fibrosis factor levels in diabetic rats. a: Collagen type IV. b: Fibronectin. c: Laminin. All data were expressed as mean ± SD, n = 5. Compared with the control group, #P < 0.05, ##P < 0.01. Compared with the diabetic model group, *P < 0.05, **P < 0.01.
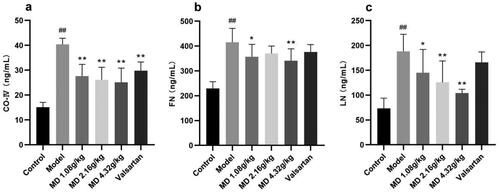
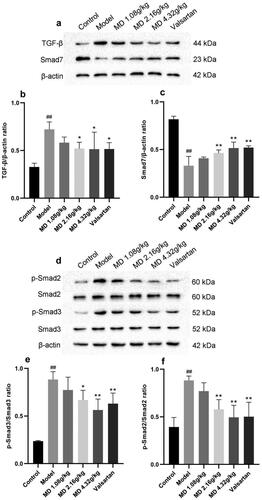
Figure 6. Effect of Mudan granules on the expression of TGF-β/Smad2/3 pathway proteins in kidney tissues of diabetic rats. a: TGF-β and Smad7 protein expression in kidney tissues of rats. b: TGF-β/β-actin ratio. c: Smad7/β-actin ratio. d: Smad2, Smad3 and phosphorylation protein expression in kidney tissues of rats. e: Smad2/p-Smad2 ratio. f: Smad3/p-Smad3 ratio. All data were expressed as mean ± SD, n = 3. Compared with the control group, #P < 0.05, ##P < 0.01. Compared with the diabetic model group, *P < 0.05, **P < 0.01.