
Figures & data
Table 1. Patients’ clinical characteristics.
Figure 1. Plasma and urine CCL2 levels between AKI and non-AKI patients at hospital and ICU admission. **p < 0.01; ***p < 0.001; ****p < 0.0001.
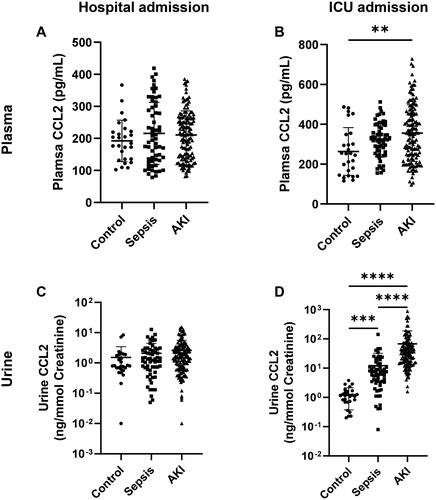
Figure 2. The predictive performance of urine CCL2 for AKI by ROC analysis. (A) ROC curve. (B) AUC and prediction sensitivity and specificity.
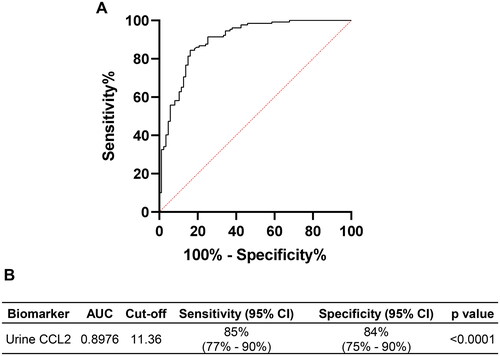
Figure 3. Plasma and urine CCL2 levels between SAKI and non-septic AKI patients at hospital and ICU admission. ***p < 0.001.
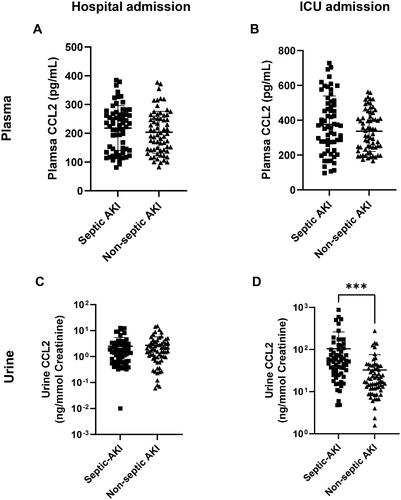
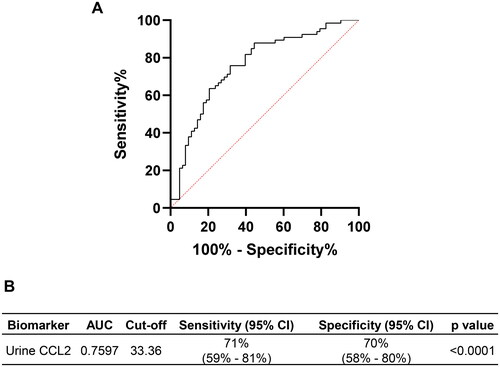
Figure 4. The predictive performance of urine CCL2 for SAKI by ROC analysis. (A) ROC curve. (B) AUC and prediction sensitivity and specificity.
Supplemental material
Supplemental Material
Download PDF (153.7 KB)Availability of data and materials
The data that support the findings of this study are available from the corresponding author upon reasonable request.