Figures & data
Figure 1. (a) Flowchart of patient inclusion and (b) cumulative incidence of the primary outcome. In original cohort of 252 patients with IgA nephropathy, 185 patients were enrolled in the final validation cohort.
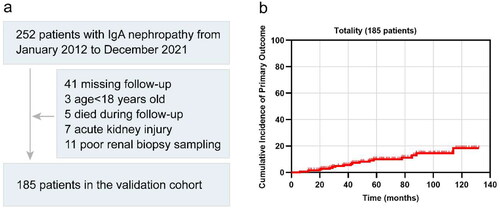
Table 1. Comparison of baseline characteristics among the external validation cohort, original derivation cohort, and original validation cohort.
Figure 2. Survival curves across four risk subgroups determined by the percentile of linear predictors from (a) model including race parameter or (b) model excluding race parameter. The risk subgroups were categorized as <16th, low risk; 16–50th, intermediate risk; 50–84th, higher risk; >84th, highest risk.
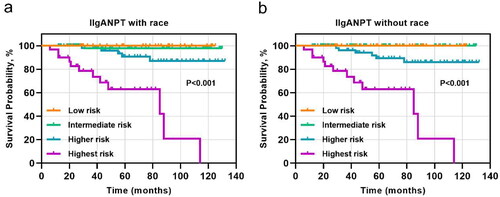
Table 2a. Comparison of clinical and histological characteristics among four risk subgroups based on the model including race parameter.
Table 2b. Comparison of clinical and histological characteristics among four risk subgroups based on the model excluding race parameter.
Figure 3. ROC curve at 5 years for (a) model including race parameter or (b) model excluding race parameter.
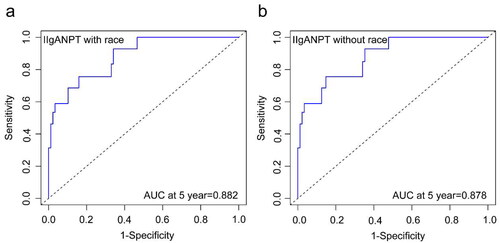
Figure 4. Calibration plots for 5-year predicted risk depicted that both (a) model including race parameter and (b) model excluding race parameter achieved sound calibration.
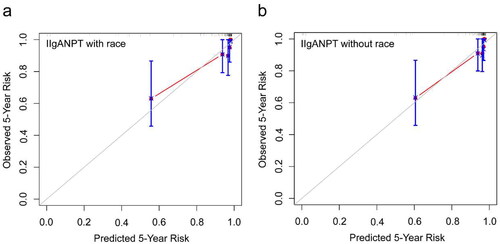
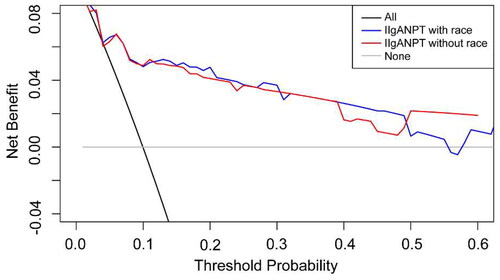
Figure 5. Decision curve analysis employing 5-year predicted risk demonstrated that both models exhibited a positive net benefit and the decision curves positioned above the None line and the All line across a broad threshold range.