
Figures & data
Figure 1. Flowchart of the cross-sectional study.
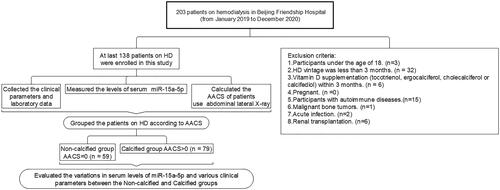
Figure 2. Radiological quantification of abdominal aortic calcification using abdominal lateral X-ray. Arrowhead denotes calcification sites.
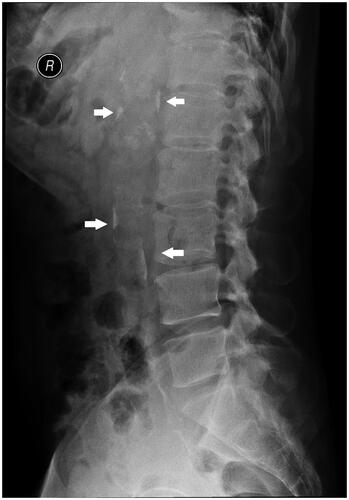
Figure 3. The association between serum miR-15a levels in patients and vascular calcification severity. The Kruskal–Wallis rank-sum test was used to compare relative miR-15a expression between groups. The Wilcoxon test was used to compare other groups with the ‘non-calcification’ group. ****p < 0.00001; ***p < 0.001; **p < 0.01. Comparisons between the other three groups showed no significant differences.
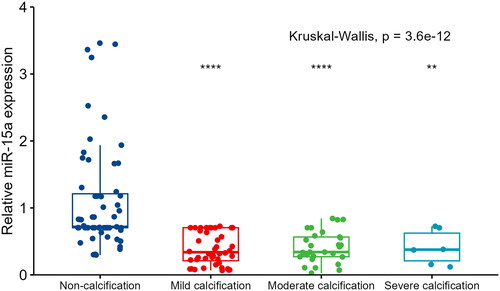
Table 1. Characteristics of patients undergoing hemodialysis with vascular calcification.
Table 2. Univariate and multivariate logistic regression analysis of the result of vascular calcification and clinical candidate predictors.
Figure 4. Discrimination of the miR-15a-based nomogram for determining vascular calcification in the patients.
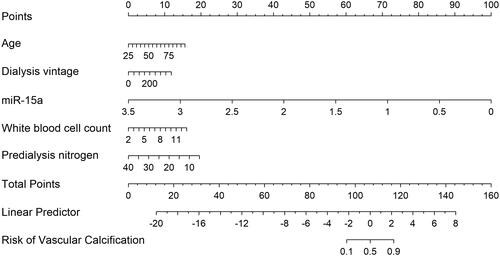
Figure 5. miR-15a-based nomogram for predicting the probability of vascular calcification in patients. The range of the total points for the nomogram is 0–160. The X-axis represents the predicted risk of VC development in patients undergoing hemodialysis. The Y-axis displays the actual CVC diagnosis. The dashed diagonal line represents the ideal prediction of an ideal model. The solid line represents the performance of the nomogram, with closer proximity to the dashed line indicating higher accuracy of the predictions of the model.
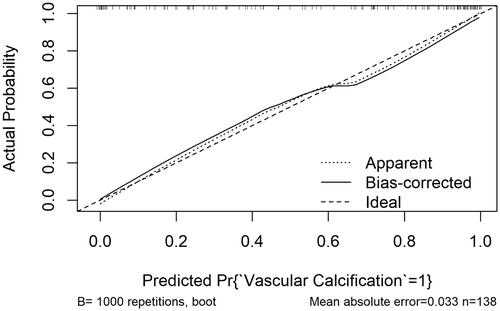
Figure 6. Comparison of the three models in discrimination ability. Model 1: miR-15a+age + dialysis vintage + predialysis nitrogen + white blood cell count, Model 2: miR-15a, Model 3: Age + dialysis vintage + predialysis nitrogen + white blood cell count.
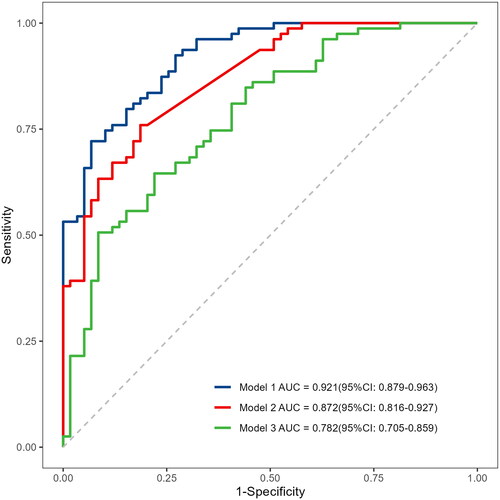
Table 3. Evaluation of prediction models.
Supplemental Material
Download PDF (98 KB)Data availability statement
The original contributions of this study are available from the corresponding author upon reasonable request.