Figures & data
Table 1. Sociodemographic and clinical characteristics in kidney transplant patients.
Figure 1. Oxidant and anti-oxidant plasma levels in kidney transplant patients based on post-transplantation period. Comparison between patients with early PT (PTP ˂ 1 year), intermediate PT (PTP between 1–5 years), and late PT (PTP > 5 years). (A) Comparison with MDA level. (B) Comparison with AOPP level. (C) Comparison with ascorbic acid level. (D) Comparison with GSH level. (E) Comparison with GPx activity. (F) Comparison with SOD activity. Tukey’s test applied for the comparisons. Each column represents mean ± SEM. *p<0.05, compared patients with early PT to patients with late PT. #p<0.05, compared patients with intermediate PT to patients with late PT.
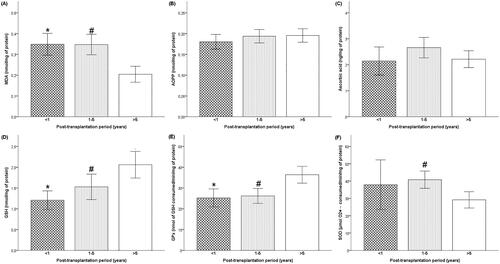
Figure 2. Oxidant and anti-oxidant plasma levels in kidney transplant patients based on tacrolimus trough levels. Comparison between low-level TAC (LL-TAC), normal-level TAC (NL-TAC) and high-level TAC (HL-TAC) groups. (A) Comparison with MDA level. (B) Comparison with AOPP level. (C) Comparison with ascorbic acid level. (D) Comparison with GSH level. (E) Comparison with GPx activity. (F) Comparison with SOD activity. Tukey’s test applied for the comparisons. Each column represents mean ± SEM. *p<0.05, compared the low-level TAC group to the high-level TAC group. #p<0.05, compared the normal-level TAC group to the high-level TAC group.
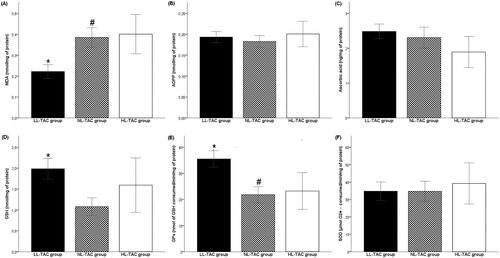
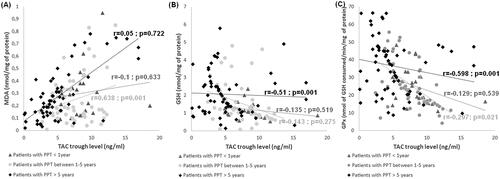
Figure 3. Correlations analyses between oxidative stress markers and tacrolimus trough levels according to post-transplantation period. (A) Correlation between MDA level and tacrolimus trough level. (B) Correlation between GSH level and tacrolimus trough level. (C) Correlation between GPx activity and tacrolimus trough level.