
Figures & data
Figure 1. Patient selection flow chart.
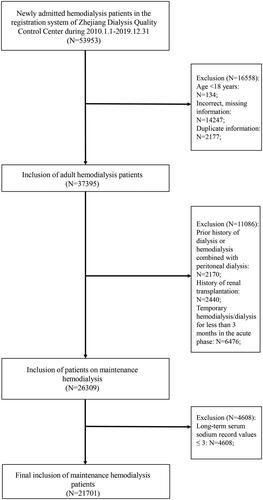
Table 1. Baseline information on maintenance hemodialysis patients grouped according to long-term serum sodium levels (N = 21701).
Figure 2. Curve relationship between mean long-term SNa level with HR for all-cause mortality. SNa level is used as a continuous variable on the x-axis, and black curve represents the median adjusted HR, while gray portion represents the 95% confidence interval of the adjusted HR. Na: serum sodium level.
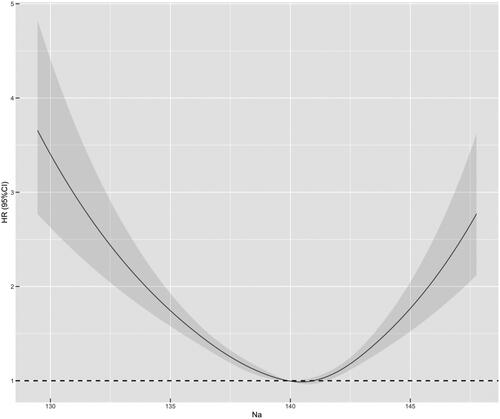
Figure 3. Comparison of survival by cause of death in groups with different long-term SNa levels in MHD patients (Kaplan–Meier survival curves). The horizontal coordinate is the follow-up time (months) and the vertical coordinate is the cumulative survival rate or mortality rate. A: All-cause mortality; B: Cardiovascular deaths; C: Infection deaths; D: Cerebrovascular death.
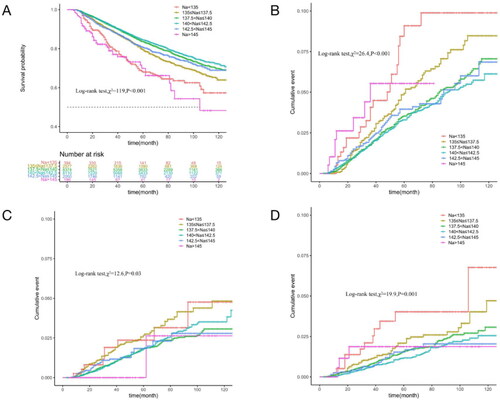
Table 2. Cox regression analysis of long-term serum sodium levels and all-cause mortality (N = 21701).
Figure 4. Distribution of the 21,701 patients in terms of the number of different indicators. N: numbers of cases. A: Coefficient of variation (CV), divided into the following six groups: CV = 0 (N = 107, 0.5%); CV = 0.01 (N = 7252, 33.4%); CV = 0.02 (N = 10981, 50.6%); CV = 0.03 (N = 2513, 11.6%); CV = 0.04 (N = 510, 2.4%); CV = 0.05 (N = 152, 0.7%); CV > 0.05 (N = 186, 0.8%); B: the rate of variation (RV) (%), divided into the following 6 groups: 0%≦RV < 5% (N = 13383, 61.7%); 5%≦RV < 10% (N = 7167, 33.0%); 10%≦RV < 20% (N = 864, 4.0%); 20%≦RV < 30% (N = 68, 0.3%); 30%≦RV < 40% (N = 164, 0.8%); 40%≦RV (N = 55, 0.2%).
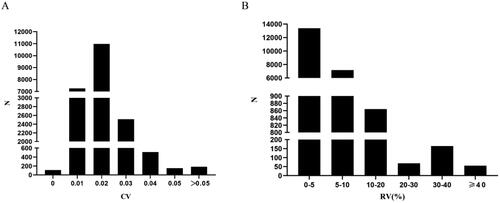
Figure 5. Curves of HR with each continuous variable in multifactorial Cox regression for long-term HD patients. In which, each index is used as a continuous variable on the X-axis, the red curve (HR) represents the adjusted HR, whereas the blue (HR_lwr) and green (HR_upr) curves represent the 95% confidence intervals of the HR. A: Curve of HR with the coefficient of variation (CV); B: Curve of HR with the quantity of SNa variation (QV).
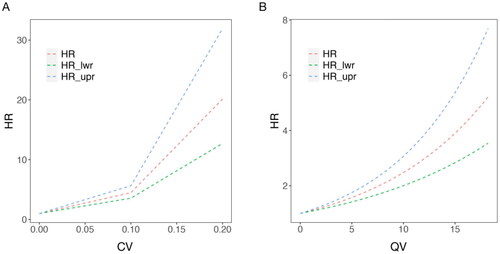
Table 3. Cox regression analysis of CV/QV and all-cause mortality (N = 21701).