Figures & data
Figure 1. The inclusion and exclusion flowchart.
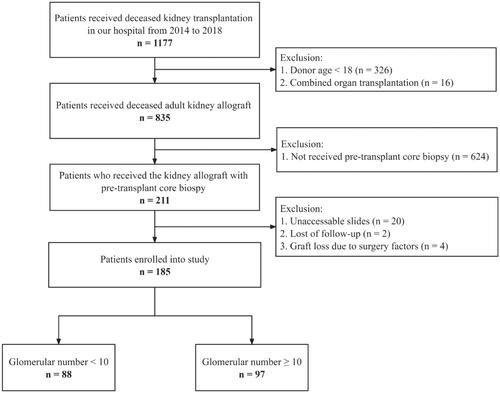
Table 1. Demographic and clinical characteristics of recipients.
Figure 2. Comparison Of allograft prognosis in specimens with a glomerular number ≥ 10, stratified across each scoring system pre-defined risk groups. (A) The Kaplan-Meier death-censored graft survival curves for different scoring systems. (B) Comparison of DGF incidence between Mild/no and M-S grades.
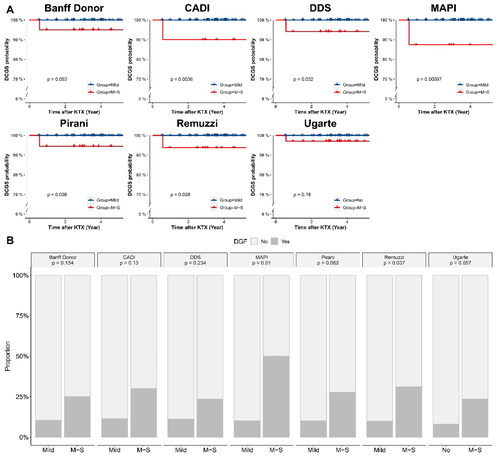
Figure 3. eGFR Boxplot of recipients in different grades of different scoring systems in specimens with a glomerular number ≥ 10. (A) Banff donor scoring system; (B) CADI scoring system; (C) DDS scoring system; (D) MAPI scoring system; (E) Pirani scoring system; (F) Remuzzi scoring system; (G) Ugarte scoring system.
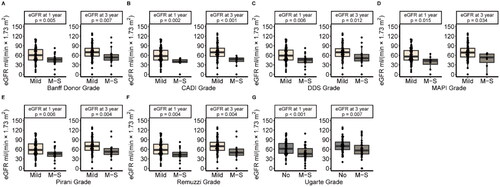
Table 2. AdjustedTable Footnote* odd ratios (or) for DGF in recipients receiving allografts with CB specimens’ glomerular number ≥ 10.
Figure 4. Comparison Of the goodness of fit of linear regression models established in specimens with a glomerular number ≥ 10. The total-score-based models predicted eGFR. The goodness of fit of each model was compared with the DDS scoring system for one-year eGFR prediction and CADI for 3-year eGFR prediction, by the Vuong test. Label * would be assigned only if a model differed significantly from the reference model.
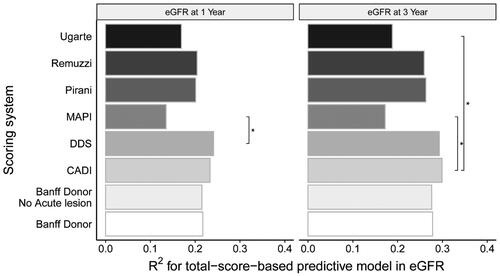
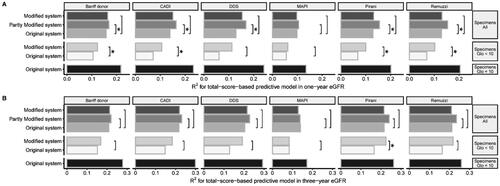
Figure 5. Comparison Of the goodness of fit of linear regression models. (A) One-year eGFR prediction; (B) Three-year eGFR prediction. The total-score-based models predicted eGFR in different specimens. The goodness of fit of each model was compared with the original scoring system as the reference scoring system, by the Vuong test. Label * would be assigned only if a model differed significantly from the reference model.