
Figures & data
Table 1. The primers for RT-qPCR.
Figure 1. The I/R induces the EMT process and renal fibrosis in mice.
(A) The representative images of kidney sections from each group of mice after H&E and Masson staining (magnification x 400); (B–C) Renal tubular injury index and fibrotic areas; (D–E) Scr and BUN levels in the indicated groups of mice; (F) NGAL levels in the indicated groups of mice; (G) The levels of miR-101 transcripts in mice. (H) FISH analysis of miR-101 transcripts in kidney tissue sections. (I) RT-qPCR analysis of the relative levels of Vimentin, E-cadherin, COL10A1 and KLF4 mRNA transcripts in kidney tissues of the Sham and I/R groups of mice; (J, K) Western blot analysis of the relative levels of Vimentin, E-cadherin, COL10A1 and KLF4 protein expression in kidney tissues of the Sham and I/R groups of mice. (L) Immunohistochemistry analysis of COL10A1 and KLF4 expression in kidney tissues of both groups of mice. Data are presented as means ± SD of each group (n = 10). *p < 0.05, **p < 0.01, ***p < 0.001.
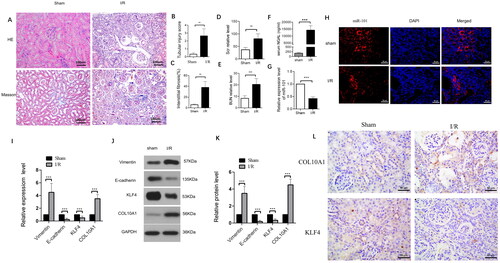
Figure 2. COL10A1 is one of the targets of miR-101.
(A) COL10A1 was predicted as one of the potential targets of miR-101 in TargetScan (http://www.targetscan.org). (B) Conserved miR-101-binding sites in the 3’-UTRs of COL10A1 mRNA. Luciferase reporter assays reported that transfection of miR-101 mimic inhibited the wild-type COL10A1 3’UTR, but not its mutant-regulated luciferase expression in the 293T cells. (C) Effects of miR-101 mimics on the levels of endogenous COL10A1 and COLI mRNA transcripts in HK-2 cells under the indicated conditions, determined by RT-qPCR. (D) Transfection with miR-101 mimics decreased the levels of endogenous COL10A1 protein expression in HK-2 cells under the indicated conditions, but not COL I. Data are presented as means ± SD of each group from three separate experiments. *p < 0.05, **p < 0.01, ***p < 0.001; n =3.
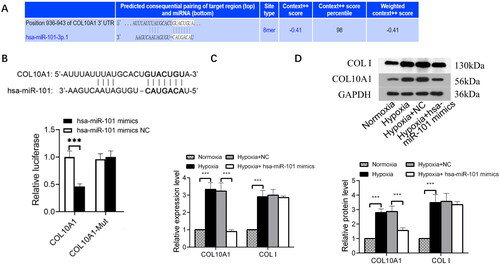
Figure 3. Col10a1 Is crucial for the I/R-induced renal injury, fibrosis and EMT process in the AKI-CKD mice.
(A) Representative images of HE and Masson’s trichrome-stained kidney sections (bars = 100 μm). (B) Renal tubular injury scores. (C) Fibrotic areas. (D-E) The levels of BUN and Scr. (F) ELISA measured the levels of serum NGAL in mice. (G) the relative levels of Col10a1, ColI, E-cadherin and Vimentin mRNA transcripts in kidney tissues. (H-I) Western blotting analysis of the relative levels of Col10a1, ColI, E-cadherin and Vimentin expression in the kidney tissues of mice. (J) Immunofluorescence analysis of E-cadherin and Vimentin expression in kidney tissue sections from the indicated groups of mice. Data are representative images or presented as means ± SD of each group (n = 10) from three independent experiments. ** p < 0.01, *** p < 0.001.
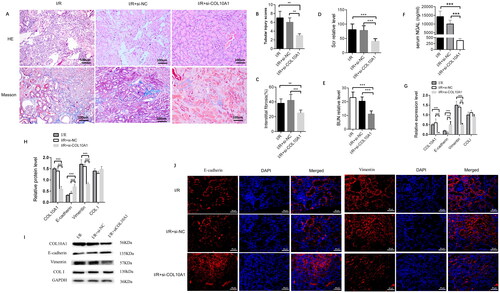
Figure 4. COL10A1 silencing mitigates the hypoxia-induced morphological changes and NGAL expression in HK-2 cells.
HK-2 cells were transfected with control scrambled siRNA (NC) or COL10A1-specific siRNA for 48 h. Different groups of cells were cultured under a normoxic or hypoxic condition for 48 h. The cell morphology and relative levels of COL10A1 and NGAL expression in different groups of cells were examined. (A) Morphological observations of different groups of cells (magnification x100). (B) RT-qPCR analysis of COL10A1 mRNA transcripts in the different cell groups. (C–E) Western blot analysis of COL10A1 and NGAL expression in different groups of HK-2 cells. Data are representative images or are presented as the mean ± SD of each group (n = 3) from three independent experiments, ** p < 0.01, *** p < 0.001.
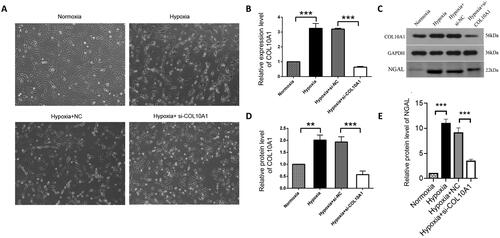
Figure 5. COL10A1 silencing inhibits the EMT process induced by hypoxia in HK-2 cells. (A, B) Immunofluorescent analysis of E-cadherin and Vimentin expression in different groups of cells. Bar = 50 μm. (C) Quantitative analysis of fluorescent signals. (D–E) Quantitative analysis of E-cadherin, Vimentin and αSMA expression in the indicated groups of cells. Data are representative images or presented as means ± SD of each group from three independent experiments. * p < 0.05, ** p < 0.01, *** p < 0.001.
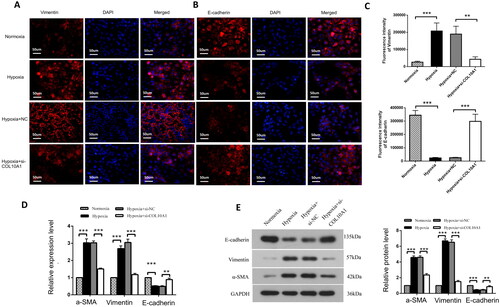
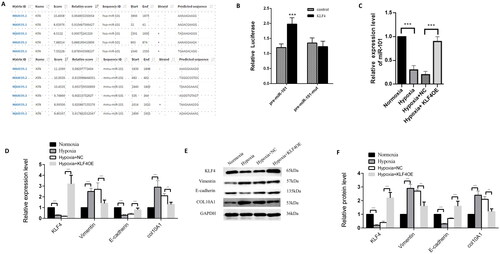
Figure 6. KLF4 induces miR-101 expression to minimize COL10A1 expression and the EMT process in HK-2 cells.
JASPAR website predicted the binding KLF4 to the miR-101 promoter region. (B) Dual-luciferase reporter assays indicated that KLF4 induced pre-miR-101 transcription in 293T cells. The pre-miR-101 indicates the pre-miR-101 promoter. The pre-miR-101 mut represents the mutant pre-miR-101 promoter. (C) KLF4 overexpression increased miR-101 expression in HK-2 cells. (D–F) RT-qPCR and Western blotting analyses of the relative levels of COL10A1 expression and EMT in the indicated groups of HK-2 cells. Data are representative images or presented as the mean ± SD of each group from three independent experiments. ** p < 0.01, *** p < 0.001.
Data availability statement
The data supporting the findings of this study are available upon request from the corresponding author.