
Figures & data
Figure 1. Differentially expressed analysis in the immature AVFs compared to the mature. (A and B) Volcano plots of DEGs using DESeq2 (A) and edgeR (B) method. (C) Venn diagram summarizing the differential and overlapping DEGs. (D) Plot of fold changes of significant DEGs in DESeq2, edgeR, and both methods. DEGs: differentially expressed genes; AVF: arteriovenous fistula.
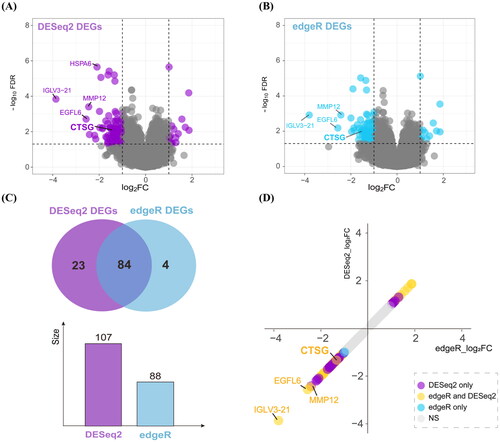
Figure 2. Function enrichment analysis and PPI network. (A) Barplot of GO enrichment analysis. Results were categorized into biological process (BP), cellular component (CC), and molecular function (MF). (B) Barplot of KEGG pathway enrichment analysis. (C) The results of GSEA. (D) PPI network of candidate genes. Nodes whose degree greater than 5 were as the candidate genes, the more central, the greater the degree values. The size and gradient color of each node represents its degree and log2FC. (E) PPI network of the genes in cluster 1. The size and gradient color of each node represents its scores and log2FC. PPI: protein–protein interaction; GO: gene ontology; KEGG: Kyoto Encyclopedia of Genes and Genomes; GSEA: gene set enrichment analysis.
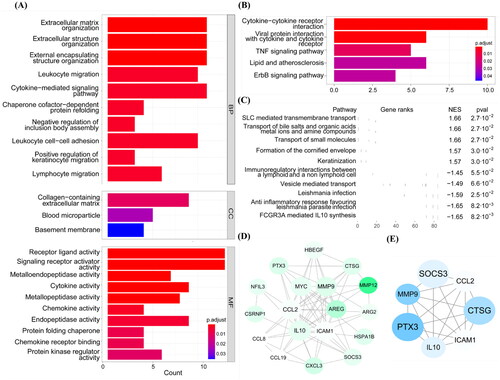
Figure 3. WGCNA analysis combined with ssGSEA. (A) Scale independence and mean connectivity with soft threshold. (B) Clustering of modules. (C) ssGSEA enrichment scores of seven ECM-related pathways in each sample. (D) Each cell contained the corresponding correlation and p values. Mature, immature, and the 1, 2, 7 refer to AVFs are anatomic maturation or nonmaturation, and the pathways in (C). (E) Scatter plot of genes in the blue module. The horizonal axis represents MM, the vertical axis represents the importance of genes for the failure outcome. Pearson correlation coefficients of MM and gene significance and the P-values are listed at the top of the plot. WGCNA: weighted gene correlation network analysis; ssGSEA: single sample gene set enrichment analysis; ECM: extracellular matrix; MM: module membership.
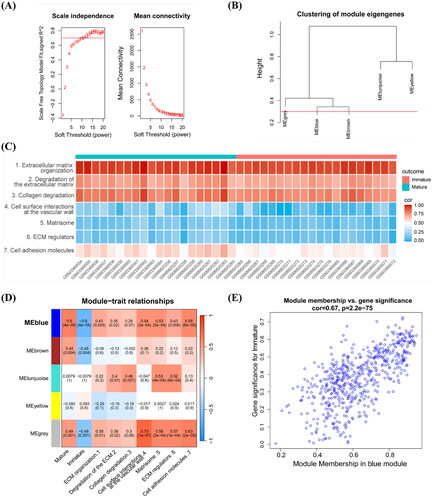
Figure 4. Screening the hub gene associated with the AVF non-maturation. (A) Results of the degree algorithm, MCODE plug-in, and WGCNA analysis screening were intersected to obtain candidate hub genes. (B) Radar chart of the three candidate hub genes with gene significance for trait scores. (C) ROC prediction analysis of the three hub candidate genes in AVFs. AUC value is on the lower right. (D,E) Lasso regression analysis. The expression levels of three candidate hub genes were used as input values for lasso selection and 10-fold cross-validation for the penalty parameters-lambda selection in the model, two variables were reserved when the lambda.min was selected. (F) Upset plot of the results in above analysis for candidate hub genes. **FDR < 0.01 indicated significant differences.
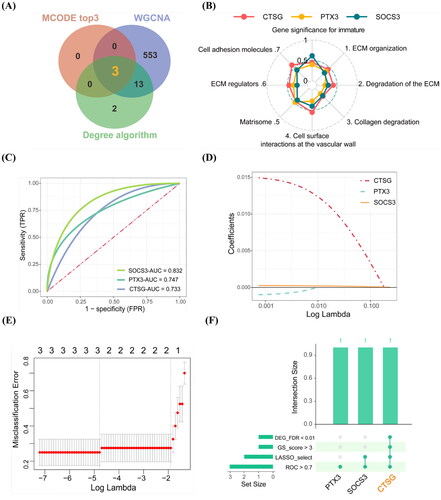
Figure 5. Downstream effector of CTSG and its gene family function. (A) GSEA was carried out according to the expression level of CTSG. (B) Barplot of GO enrichment analysis of DEGs which belong to MMP gene family. Results were categorized into biological process (BP), cellular component (CC), and molecular function (MF). (C) PPI network of CTSG and MMPs. The different color barplot represent five algorithms and the thickness of each edge represents correlation. (D) Heatmap of correlation coefficient between CTSG and MMPs. **p < 0.01 indicated significant differences. DEGs: differentially expressed genes; PPI: protein–protein interaction; GO: gene ontology; GSEA: gene set enrichment analysis.
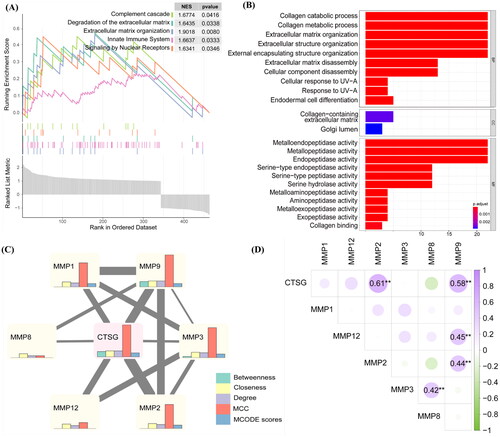
Figure 6. The expression of CTSG was decreased in immature AVF removed from patients compared to mature AVF. (A and B) Representative images of CTSG immunohistochemistry staining (A) and the positive-staining areas were statistically analyzed (B). The black arrows indicated areas of positive CTSG staining, (★) intima, (L) Lumen, and (M) media. **p < 0.01 versus maturation group. (C and D) Double-immunostaining of CTSG (red) and SMA-a (green) in the intima (C) and media (D) of AVF sample tissue. (Magnification, × 400). AVF: arteriovenous fistula.
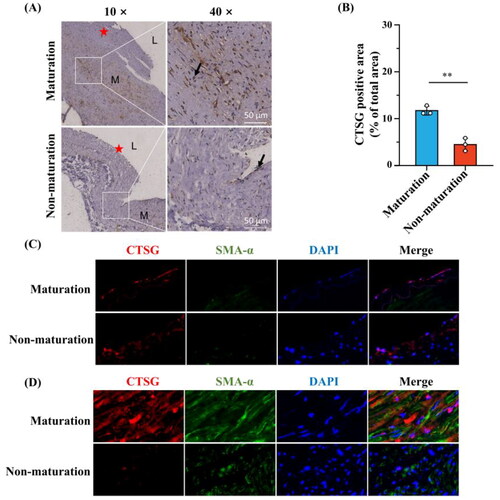
Figure 7. Medial fibrosis was more significant in the immature AVFs compared to mature AVFs. (A and B) Representative images of masson’s trichrome staining (A) and collagen volume fraction were statistically analyzed (B). (C and D) Representative images of collagen l immunohistochemistry staining (C) and the positive-staining areas were statistically analyzed (D). The black arrows indicated areas of positive collagen l staining, (★) intima, (L) Lumen, and (M) media. **p < 0.01, ***p < 0.001. AVF: arteriovenous fistula.
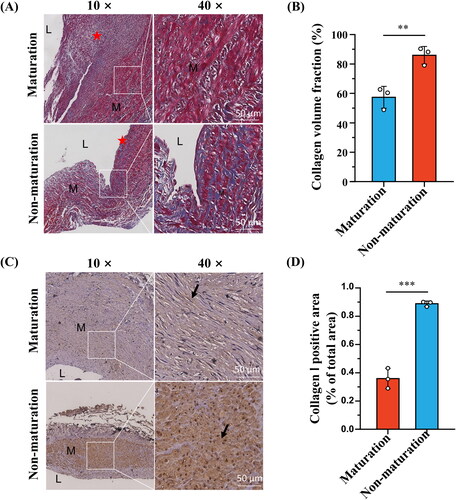
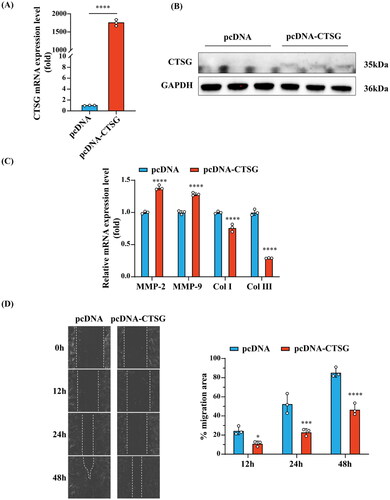
Figure 8. Effects of CTSG overexpression on VSMCs. (A) RT-qPCR validation of CTSG overexpression in VSMCs. (B) Validation of CTSG overexpression by western blotting. (C) mRNA levels of MMP2, MMP9, collagen I, and collagen III were evaluated by RT-qPCR. (D) Wound healing scratch test was performed at VSMCs. *p < 0.05, ***p < 0.001, and ****p < 0.0001. VSMCs: vascular smooth muscle cells; MMP: matrix metalloproteinase.
Supplemental Material
Download PDF (320.1 KB)Data availability statement
All data generated or analyzed during this study are included in this article. Further inquiries can be directed to the corresponding authors.