
Figures & data
Table 1. Primer sequences used for RT-qPCR.
Figure 1. Construction of the podocyte injury model. (A) RT-qPCR was used to measure the mRNA expression levels of nephrin, podocin and desmin in mouse podocytes in the control, HG, and mannitol groups. (B) Protein expression levels of related indexes in cells were assessed by western blotting. The data are expressed as the mean ± SD. *p < .05, ***p < .001 vs. the control group. NS: not significant; HG: high glucose; RT-qPCR: real-time quantitative polymerase chain reaction.
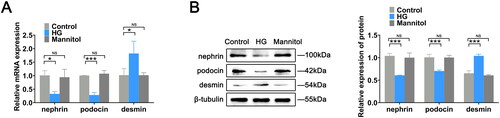
Figure 2. Expression profile of tRFs in podocytes of the HG group and control group. (A) Clustered heatmap of all tRFs in the HG and control groups. (B) Volcano plots of tRFs in the HG group compared to the control group. (C) tRFs commonly expressed and specifically expressed in the two groups. (D) Distribution of tRF subtypes in the two groups. (E) Distribution of tRFs in different tRNAs in the two groups. HG: high glucose; tRFs: tRNA-derived fragments.
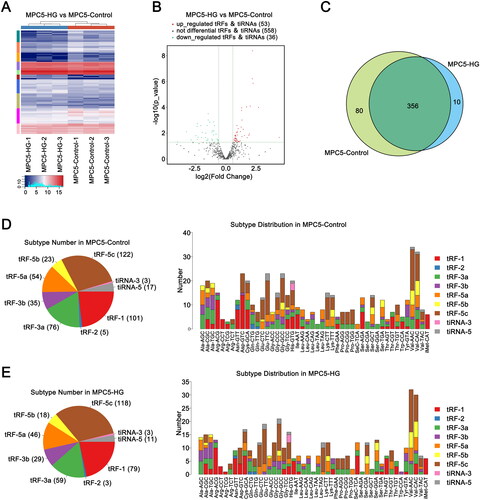
Table 2. Differentially expressed tRFs.
Figure 3. Validation of the expression levels of selected tRFs. (A) The expression levels of tRF-1:15-chrM.Ser-GCT, tRF-1:15-Thr-AGT-6, tRF-1:28-Cys-GCA-1-M3, tRF-1:29-Glu-TTC-2, and tRF-1:30-Cys-GCA-1-M3 were measured by RT-qPCR. (B) The expression levels of tRF-1:16-chrM. Met-CAT, tRF-1:24-Glu-CTC-M2, tRF-54:75-Asp-GTC-1, tRF-54:75-Glu-TTC-2, and tRF-58:75-Ala-CGC-4-M6 were measured by RT-qPCR. The data are expressed as the mean ± SD. *p < .05, **p < .01 vs. control group. NS: not significant; HG: high glucose; tRFs: tRNA-derived fragments; RT-qPCR: real-time quantitative polymerase chain reaction.
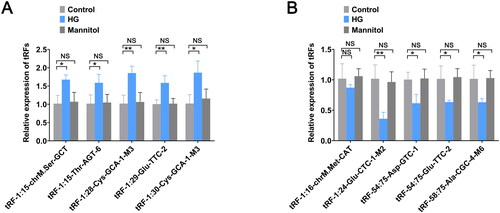
Table 3. Target genes in top 20.
Figure 4. GO and KEGG analysis of target genes. GO analysis of target genes of downregulated tRFs; BP (A), CC (B), and MF (C) terms are included in the analysis. GO analysis of the target genes of upregulated tRFs, including BP (D), CC (E), and MF (F) terms. (G, H) KEGG pathway analysis of the target genes of selected differentially expressed tRFs. GO: Gene Ontology; KEGG: Kyoto Encyclopedia of Genes and Genomes; tRFs: tRNA-derived fragments; BP: biological process; CC: cellular component; MF: molecular function; Sig: significant.
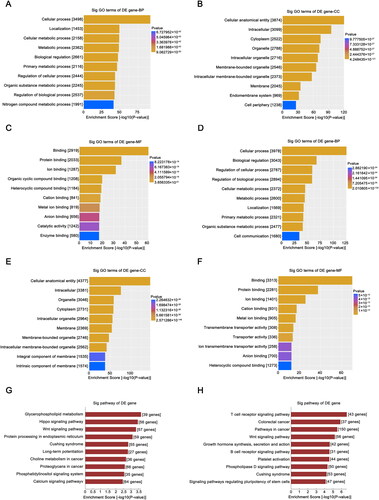
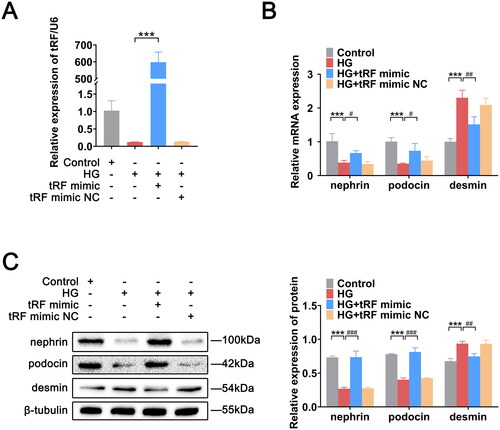
Figure 5. Overexpression of tRF-1:24-Glu-CTC-1-M2 contributes to podocyte injury mitigation. (A) Successful transfection of tRF-1:24-Glu-CTC-1-M2 in podocytes. (B) Expression levels of nephrin, podocin, and desmin mRNAs. (C) Expression levels of nephrin, podocin, and desmin proteins. The data are expressed as the mean ± SD. ***p < .001, #p < .05, ##p < .01, and ###p < .001 vs. the indicated group. HG: high glucose; tRFs: tRNA-derived fragments.
Data availability statement
The study data are available from the corresponding authors upon reasonable request.