
Figures & data
Table 1. Evidence Supporting the association between PEC and CKD.
Figure 1. Flowchart of participants selection. CKD: chronic kidney disease; eGFR-EPI: estimated glomerular filtration rate based on the EPI formula; UACR: urinary albumin to creatinine ratio. Weighted numbers are the representative national estimates, after incorporating sample weights, strata, and primary sampling units in accordance with NHANES recommendations.
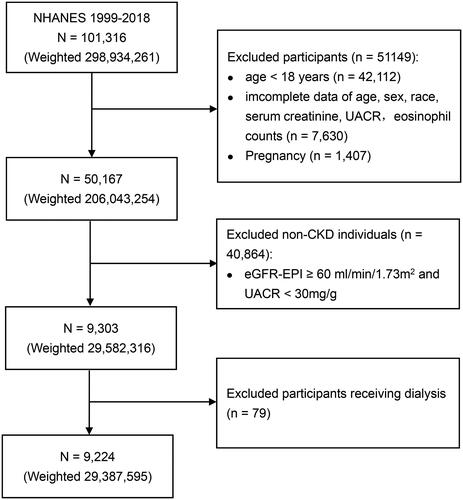
Table 2. Baseline characteristics of participants with chronic kidney disease stratified by quartiles of eosinophil counts.
Table 3. Associations between eosinophil counts and UACR and eGFR.
Figure 2. Restricted cubic spline curve for the association between eosinophils, albuminuria and estimated glomerular filtration rate. eGFR: estimated glomerular filtration rate; UACR: urinary albumin to creatinine ratio. A, eosinophils and eGFR in model 3; B, eosinophils and UACR in model 3; C, subgroup analysis for eosinophils and eGFR stratified by smoking status in model 3; D, subgroup analysis for eosinophils and UACR stratified by hypertension in model 3. Model 3 was adjusted for age (continuous), sex (male or female), race/ethnicity, BMI (<25, 25 ∼ 29.9, and 30 kg/m2), WBC (continuous), smoking behavior (former, current, or never smoker), hypertension (yes or no), diabetes (yes or no), asthma (yes or no), and UACR (≥ 30 or <30 mg/g) or eGFR (≥ 60 or <60mL/min/1.73m2), and NHANES cycles (1999–2000, 2001–2002, 2003–2004, 2005-2006, 2007-2008, 2009-2010, 2011–2012, 2013–2014, 2015-2016, 2017-2018).
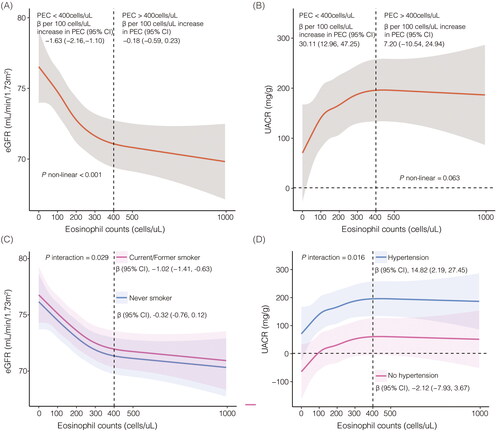
Figure 3. Subgroup analysis between eosinophils and albuminuria and estimated glomerular filtration rate in fully adjusted model. eGFR, estimated glomerular filtration rate; UACR, urinary albumin to creatinine ratio. Fully adjusted model was adjusted for age (continuous), sex (male or female), race/ethnicity, BMI (<25, 25 ∼ 29.9, and 30 kg/m2), WBC (continuous), smoking behavior (former, current, or never smoker), hypertension (yes or no), diabetes (yes or no), asthma (yes or no), and UACR (≥ 30 or <30 mg/g) or eGFR (≥ 60 or <60mL/min/1.73m2), and NHANES cycles (1999–2000, 2001–2002, 2003–2004, 2005–2006, 2007–2008, 2009–2010, 2011–2012, 2013–2014, 2015–2016, 2017–2018).
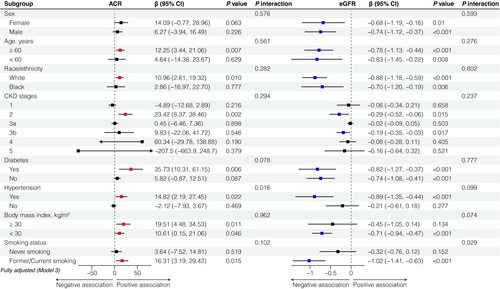
Table 4. Sensitivity analysis.
Supplemental Material
Download PDF (213.7 KB)Data availability statement
The data used this study are openly available in NHANES at https://www.cdc.gov/nchs/nhanes/.