
Figures & data
Figure 1. The Nrf2/HO-1 expressions decrease after RI/R. (A) Representative images of mouse kidney tissue. (B) Representative images of H&E staining. (C,D) Representative bar graphs of BUN and Cre levels detected through ELISA. (E) Representative bar graphs of SOD and MDA levels in serum detected using biochemical assay kits. (F) The representative bar chart of the concentrations of inflammatory factors IL-8, IL-6, and TNF-α was detected by RT-qPCR. (G) The ROS levels were detected using a ROS assay kit. (H) The representative image and quantification analysis of renal tissue apoptosis levels. (I,J) Representative images of the Nrf2/HO-1 gene and protein expression were determined by RT-qPCR and western blot, respectively. (K,L) The representative images showcasing the expressions of Nrf2/HO-1 and their quantitative statistics were gathered through IHC. n = 7-8 mice/group, Student’s t test, *p < 0.05, vs the Ctrl.
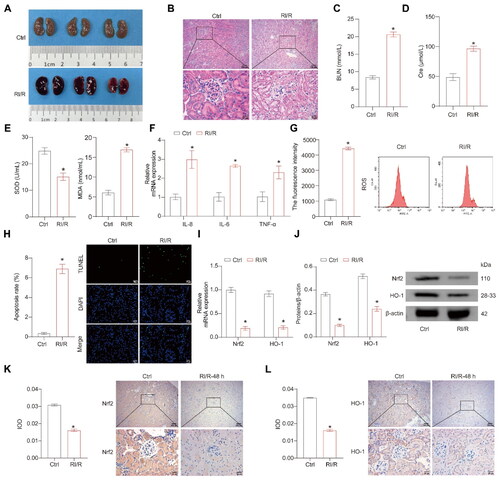
Figure 2. miR-410-3p may regulate Nrf2 through biological analysis. (A and B) Volcanic map with differential expression of miRNAs. (C) Venn diagram of highly differentially expressed miRNA. (D and E) Box diagram of miR-410-3p expressed. (F) Co-expression network diagram of Nrf2 and miRNAs. (G) Enrichment analysis of Nrf2 pathway through GO and KEGG. Student’s t test, *p < .05.
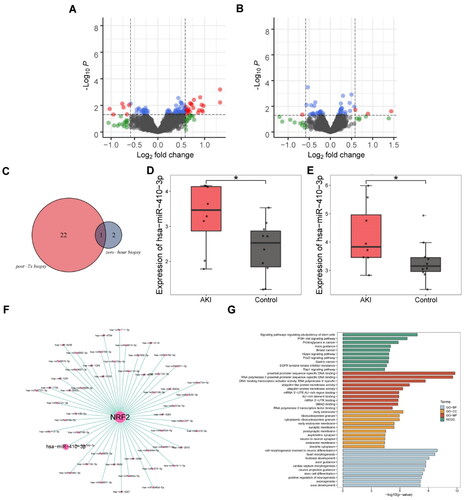
Figure 3. miR-410-3p targets Nrf2 mRNA and inhibits Nrf2/HO-1 expressions. Cells were treated with OGD/R or transfected with inhibitors, mimics, and their empty vector (NC or NC-1). (A and B) Representative images of cell apoptosis and ROS levels. (C) The concentration of inflammatory factors in the cell supernatant was detected by ELISA. (D) The levels of SOD and MDA in the cells were measured using biochemical assay kits. (E) RT-qPCR analysis of miR-410-3p expression level. (F) Different miR-410-3p inhibitors or mimics were transfected into HK-2 cells, and Nrf2/HO-1 expressions were measured via RT-qPCR. (G) Prediction of Nrf2 mRNA and miR-410-3p binding site. (H) Fluorescence activity was detected after co-transfection of Nrf2-WT or Nrf2-MUT and miR-410-3p or NC. (I) RNA pull-down assay. (J) Inhibitors or mimics of miR-410-3p were transfected into HK-2 cells, and Nrf2/HO-1 expression was measured using RT-qPCR or western blot. Student’s t test or ANOVA, *p < .05, vs. the Ctrl or NC #p < .05, vs. the NC-1.
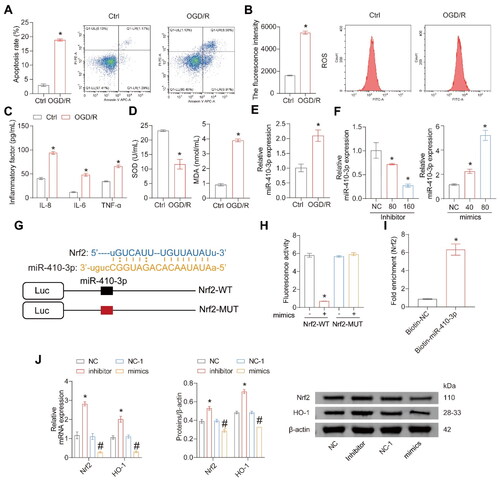
Figure 4. miR-410-3p inhibitor alleviates OGD/R-induced oxidative stress damage through the Nrf2/HO-1 axis. The cells were transfected with inhibitor and si-Nrf2 empty vector (NC and siRNA-NC), inhibitor and siRNA-NC, NC and si-Nrf2, or inhibitor and si-Nrf2, and then subjected to OGD/R treatment. (A) Nrf2 expression was detected using a western blot. (B and C) Representative images of cell apoptosis and ROS levels. (D) The concentration of inflammatory factors in the cell supernatant was detected using ELISA. (E) The levels of SOD and MDA in the cells were detected using biochemical assay kits. (F) RT-qPCR analysis of miR-410-3p, Nrf2, and HO-1 expression levels. (G) Western blot analysis of Nrf2 and HO-1 expression levels. ANOVA, *p < .05, vs. the OGD/R + NC + siRNA-NC, #p < .05, vs. the OGD/R + NC + si-Nrf2.
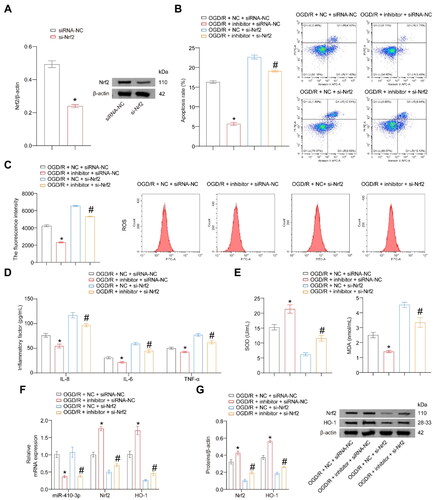
Figure 5. OIP5-AS1 binds to miR-410-3p directly. The cells were treated with OGD/R or transfected with pcDNA-OIP5-AS1, si-OIP5-AS1, pcDNA-OIP5-AS1 combined with mimics empty vector (NC-1 and pc-NC), mimics combined with pc-NC, pcDNA-OIP5-AS1 combined with NC-1, and pcDNA-OIP5-AS1 combined with mimics, respectively. (A) RT-qPCR analysis of miR-410-3p expression level. (B) Predicted binding sequences and alignment of OIP5-AS1 and miR-410-3p. (C) Fluorescence activity was measured after co-transfection of OIP5-AS1-WT or OIP5-AS1-MUT and miR-410-3p or NC-1. (D) Different amounts of OIP5-AS1 or siRNA were transfected into HK-2 cells, and OIP5-AS1 expression was measured via RT-qPCR. (E) RNA pull-down assay. (F–H) miR-410-3p mimics/NC and OIP5-AS1 were co-transfected in HK-2 cells, and Nrf2/HO-1 levels were measured using RT-qPCR and western blot, respectively. ANOVA, *p < .05, vs. the Ctrl, lnc-WT, or NC + pc-NC, #p < .05, vs. the NC-1 + pcDNA-OIP5-AS1.
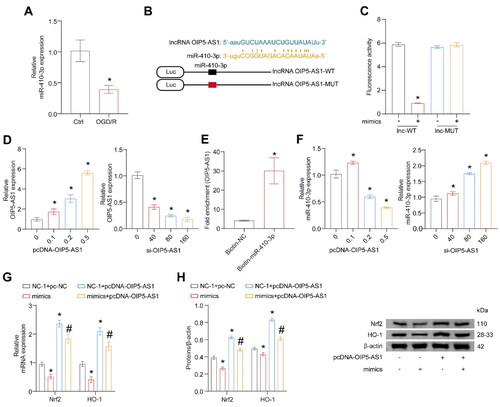
Figure 6. POP-NPs suppress oxidative stress injury in the OGD/R group through the miR-410-3p/Nrf2/HO-1 axis. Cells were transfected with POP-NPs and mimics negative control (Vector and NC-1), POP-NPs and NC-1, Vector and mimics, as well as POP-NPs and mimics. Afterward, they were treated with OGD/R in the presence or absence of Nrf2 agonists (Bardoxolone, 0.3 μM, HY-14909, MCE). (A) The apoptosis was detected using flow cytometry. (B) The ROS level of HK-2 cells was measured using DCFH-DA fluorescence. (C) The level of inflammatory factors was measured via ELISA. (D) SOD and MDA levels of the supernatant were measured using a spectrophotometer. (E and F) OIP5-AS1, miR-410-3p, and Nrf2/HO-1 expressions were measured via RT-qPCR and western blot. ANOVA, *p < .05, vs. the OGD/R + Vector + NC-1, #p < .05, vs. the OGD/R + POP-NPs + NC-1, &p < .05, vs. the OGD/R + POP-NPs + mimics.
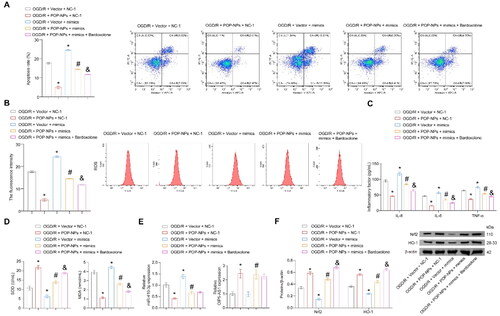
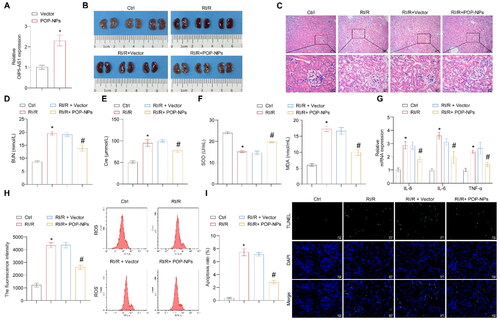
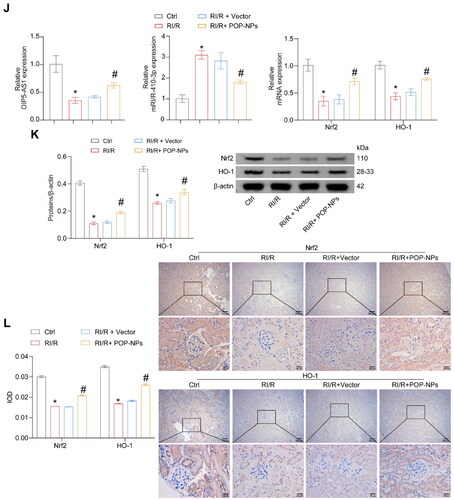
Figure 7. The influence of POP-NPs on the RI/R and miR-410-3p/Nrf2/HO-1 pathway in vivo. (A) Detection of OIP5-AS1 expression in the tissue. Normal mice were injected with either Vector or POP-NPs. (B) Representative images of mouse kidney tissue. (C) Representative images of H&E staining. (D and E) Representative bar graphs of BUN and Cre levels detected through ELISA. (F) Representative bar graphs of SOD and MDA levels in serum detected using biochemical assay kits. (G) The representative bar chart of the concentrations of inflammatory factors IL-8, IL-6, and TNF-α was detected by RT-qPCR. (H) The ROS levels were detected using a ROS assay kit. (I) The representative image and quantification analysis of renal tissue apoptosis levels. (J) Representative images of the OIP5-AS1, miR-410-3p, and Nrf2/HO-1 gene expressions were determined by RT-qPCR. (K) Representative images of the Nrf2/HO-1 protein expressions were determined by western blot. (L) The representative images showcasing the expressions of Nrf2/HO-1 and their quantitative statistics were gathered through IHC. n = 6–8 mice/group, ANOVA, *p < .05, vs. the Ctrl, #p < .05 vs. the RI/R + Vector.
Supplemental Material
Download PDF (88.8 KB)Data availability statement
The data that support the findings of this study are available from the corresponding author upon reasonable request.