
Figures & data
Figure 1. Study flowchart.
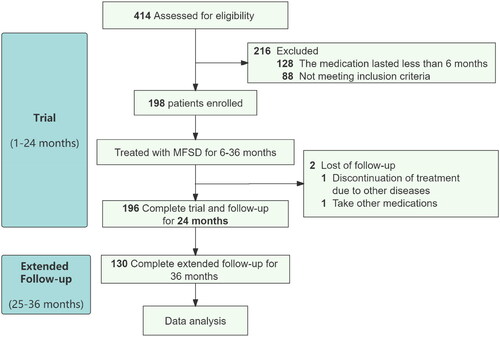
Table 1. Baseline clinical characteristics of participants.
Table 2. Response rate of participants at 12, 24, and 36 months.
Table 3. Baseline clinical characteristics of participants (grouped according to HIST or age, respectively).
Figure 2. Survival analysis of remission rates. (A, B) The survival analysis of PR + CR or CR rate, grouped according to with or without HIST. The light blue line means with HIST, the dark blue line means without HIST, and the red line means total. (C, D) The survival analysis of PR + CR or CR rate, grouped according to whether the age is over 60 years old. The light blue line means elder, the dark blue line means youth, and the red line means total. Other abbreviations are the same as the previous tables.
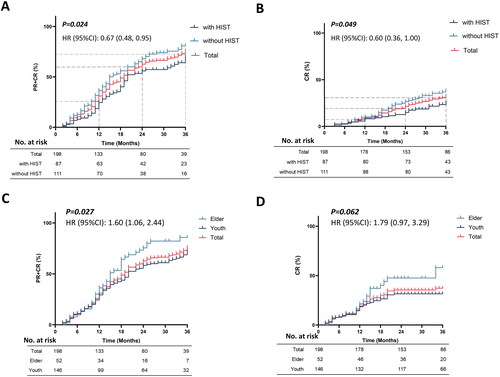
Table 4. Response rate of participants at 12, 24, and 36 months (grouped according to HIST or age, respectively).
Figure 3. The change trend of primary indexes. (A) 24hUP trend for PR + CR patients, non-remission patients, and all patients. The dashed line below indicates that 24hUP is less than 3.5 g/d. (B) ALB trend for PR + CR patients, non-remission patients, and all patients. The dashed line above indicates that ALB is greater than 35 g/L. The dark blue square indicates no remission, the light blue triangle indicates PR + CR, and the red circle indicates all patients.
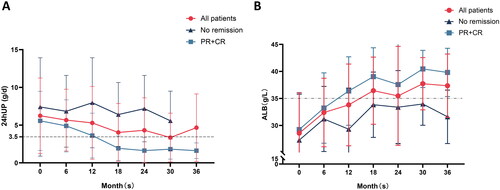
Figure 4. Forest plots of hazard ratios in baseline predictors for remission. The blue squares show no statistical differences and red triangle indicates statistical difference. The dashed line indicates that HR = 1.0. To the left of the dashed line indicates that this factor is a risk factor for remission, to the right of the dashed line indicates a beneficial factor, and crossing the dashed line indicates that this factor has no effect on MN remission.
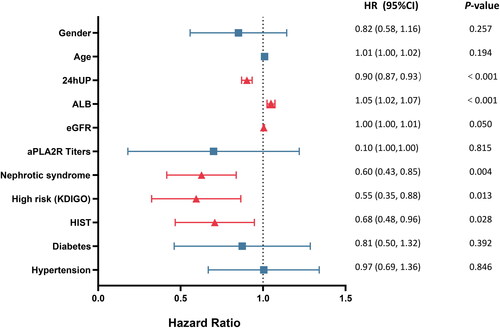
Table 5. Correlation between baseline predictors and mitigation outcomes by multivariate COX regression analysis.
Supplemental Material
Download PDF (347.2 KB)Data availability statement
The datasets used and/or analyzed during the current study are available from the corresponding author upon reasonable request.