Figures & data
Figure 1. Flow chart of research method.
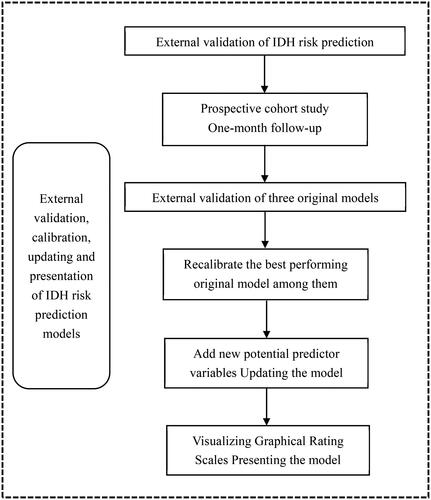
Figure 2. Flowchart recruitment process of the study population.
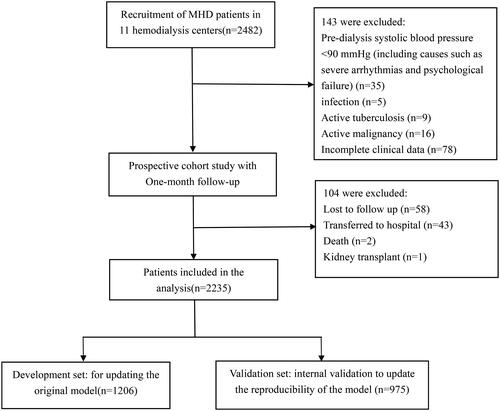
Table 1. Baseline patient characteristics.
Figure 3. ROC curves for predicting the occurrence of IDH in MHD patients. AUC = 0.5 indicates no discrimination whereas AUC = 1.0 indicates perfect discrimination. The solid reference line refers to no discrimination.
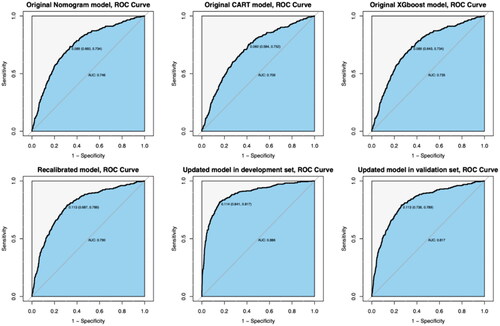
Figure 4. Calibration plots for predicting the occurrence of IDH. Note: The red reference line indicates a perfect fit, i.e., the predicted probability of IDH occurrence is the same as the observed probability of IDH occurrence.
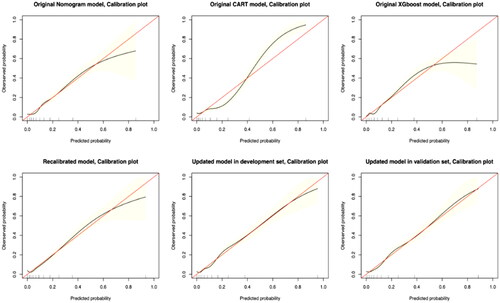
Table 2. Summary and comparison of model performance.
Table 3. Parameter estimation in the models.
Figure 5. DCA analysis of the updated model.
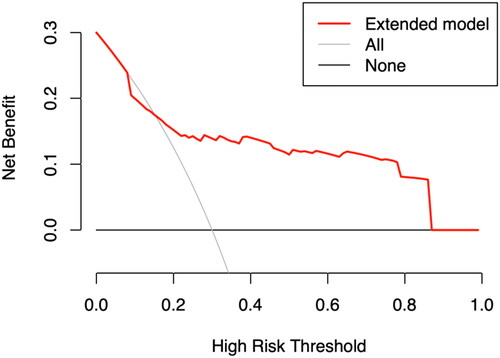
Figure 6. Node plot of the risk grade of IDH in MHD patients.
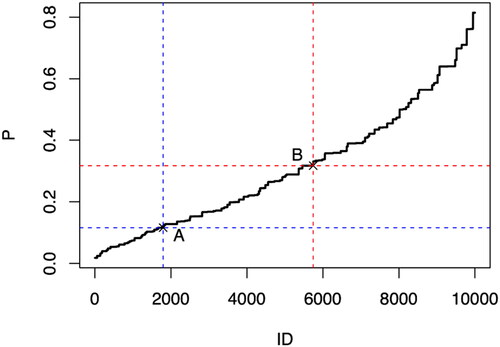
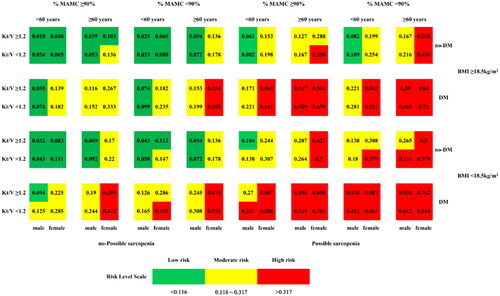
Figure 7. Graphical score chart for probability of IDH for patients with MHD. The number in each box indicates the probability of occurrence of IDH, and the three colors represent different risk levels; %MAMC: Standard percentage of MAMC; MAMC: Mid-arm muscle circumference; Kt/V: dialysis adequacy; BMI: body mass index; DM: diabetes mellitus.