
Figures & data
Table 1. Sequences used for transfection.
Table 2. Sequences of primers.
Figure 1. Overexpression of FTO in PTECs diminished TNF-α-induced viability decrease and apoptosis induction, while its silence did oppositely. (A–C) Validation on the transfection efficiency of FTO-specific overexpression plasmid and shRNA into human PTECs HK-2 via quantitative real-time PCR and western blot. β-actin was the housekeeping control. (D) CCK-8 assay results displaying the relative cell viability (%) of human PTECs HK-2 following the intervention of TNF-α and the transfection of FTO-specific overexpression plasmid and shRNA (48 hours). (E) Representative TUNEL staining results hinting the possible effects of TNF-α exposure and FTO-specific overexpression plasmid and shRNA intervention on the apoptosis of human PTECs HK-2 (indicated as green fluorescence). Magnification: 200 times. Scale bar = 50 µm. All experiments were performed in independent triplicates, and the data are expressed as mean ± standard deviation (n = 3). ***p or ^^^p or ###p or +++p or ΔΔΔp < 0.001. * vs. shNC; ^ vs. NC; # vs. Control; + vs. TNF-α+shNC; Δ vs. TNF-α+NC. Abbreviations: FTO, FTO alpha-ketoglutarate-dependent dioxygenase; TNF-α, tumor necrosis factor-α; PTECs, proximal tubular epithelial cells; shRNA, short-hairpin RNA; NC, negative control; CCK-8, cell counting kit-8; DAPI, 4’,6-Diamidino-2-phenylindole dihydrochloride; TUNEL, Terminal deoxynucleotidyl transferase dUTP nick end labeling.
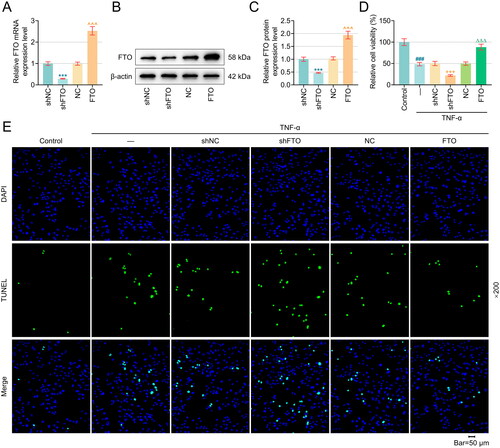
Figure 2. Overexpression of FTO reversed TNF-α-induced damage to apoptosis-related proteins, PTECs and the AQP3/β-Catenin axis, while downregulation of FTO did the opposite. (A–D) Western blot was used to measure the expression of Bax, Cleaved-caspase 3 and Bcl-2. (E–F) Flow cytometry (equipped with a DCFH-DA probe) was adopted to assess ROS generation in PTECs with various interventions. (G–H) Relevant quantification on SOD and MDA contents in TNF-α-induced PTECs with intervention of FTO-specific overexpression plasmid and shRNA. (I) Representative protein bands displaying AQP3 and β-Catenin protein expressions in TNF-α-induced PTECs with intervention of FTO-specific overexpression plasmid and shRNA based on western blotting. (J–K) Quantified AQP3 (J) and β-Catenin (K) protein expressions in TNF-α-induced PTECs with intervention of FTO-specific overexpression plasmid and shRNA based on western blotting. β-actin was the housekeeping control. All experiments were performed in independent triplicates, and the data are expressed as mean ± standard deviation (n = 3). +p or Δp < 0.05. ΔΔp or ##p < 0.01. ###p or +++p or ΔΔΔp < 0.001. # vs. Control; + vs. TNF-α+shNC; Δ vs. TNF-α+NC. Abbreviations: ROS, reactive oxygen species; DCFH-DA, 2’,7’-Diochlorofluorescin Diacetate; FITC, fluorescein isothiocyanate; MFI, mean fluorescence intensity; SOD, superoxide dismutase; MDA, malonaldehyde; AQP3, Aquaporin 3.
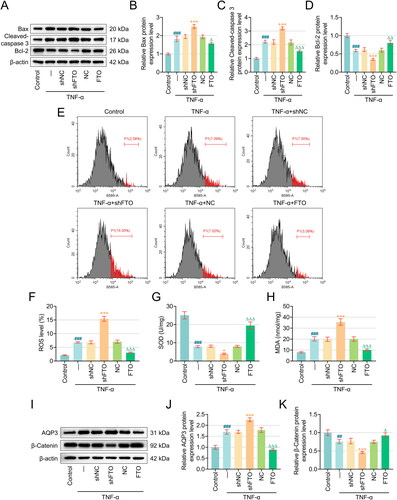
Figure 3. FTO negatively mediated AQP3 level in RTECs in an m6A-depenent manner and detriminished AQP3 stability. (A–C) The possible interaction between FTO and AQP3 was investigated based on the results from quantitative real-time PCR and western blot. β-actin was the housekeeping control. (D–E) Agarose gel electrophoresis (D) and MeRIP (E) were implemented to reveal the presence of AQP3 m6A modification. (F) MeRIP was carried out again to reveal the impact of FTO silencing on AQP3 m6A modification. (G) The results from mRNA stability assay addressing the effects of FTO silencing on the stability of AQP3 in PTECs using Actinomycin D for 0, 3 and 6 hours. β-actin was the housekeeping control. (H–I) Validation on AQP3 overexpression plasmid transfection efficiency via quantitative real-time PCR And western blot. β-actin was the housekeeping control. All experiments were performed in independent triplicates, and the data are expressed as mean ± standard deviation (n = 3). ^^p <0.01, ***p or ^^^p or ε ε εp < 0.001. * vs. shNC, ε vs. IgG; ^ vs. NC. Abbreviations: m6A, N6-methyladenosine; MeRIP, Methylated RNA immunoprecipitation.
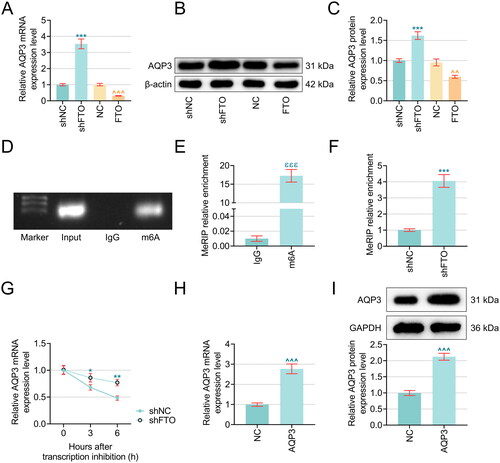
Figure 4. AQP3 overexpression neutralized the effects of FTO overexpression on the TNF-α-induced PTECs viability and apoptosis. (A–B) The results from CCK-8 (A) and TUNEL staining assays (B) were summarized to reveal the interplay between AQP3 and FTO in TNF-α-induced PTECs. Magnification: 200 times. Scale bar = 50 µm. (C–F) The expression of Bax, Cleaved-caspase 3 and Bcl-2 was detected by western blot. All experiments were performed in independent triplicates, and the data are expressed as mean ± standard deviation (n = 3). ^^p or ω ωp < .01. ^^^p or θ θ θp or ω ω ωp < .001. ^ vs. NC; θ vs. AQP3; ω vs. FTO.
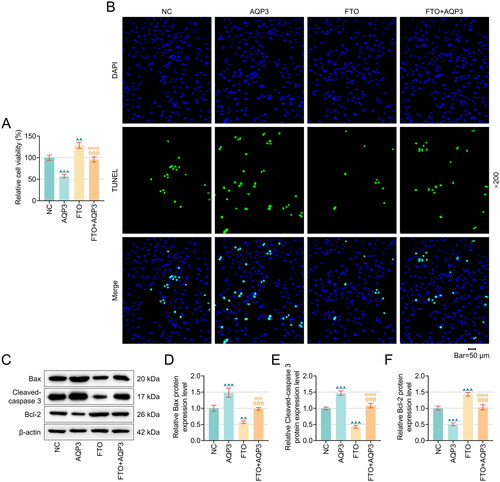
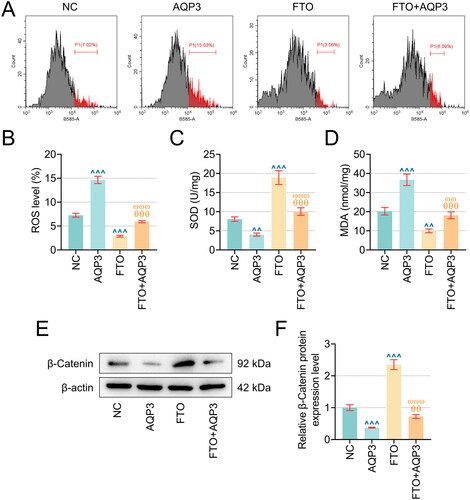
Figure 5. AQP3 overexpression cancelled the effects of FTO overexpression in TNF-α-induced PTECs on PTECs damage and β-Catenin protein expression. (A–B) Flow cytometry (equipped with a DCFH-DA probe) was adopted to assess ROS generation in TNF-α-induced PTECs with FTO and/or AQP3 overexpression. (C–D) Relevant quantification on SOD and MDA contents in TNF-α-induced PTECs with intervention of FTO and/or AQP3 overexpression. (E) Representative protein bands displaying β-Catenin protein expressions in TNF-α-induced PTECs with intervention of FTO and/or AQP3 overexpression based on western blotting. (F) Quantified AQP3 protein expression in TNF-α-induced PTECs with FTO and/or AQP3 overexpression based on western blotting. β-actin was the housekeeping control. All experiments were performed in independent triplicates, and the data are expressed as mean ± standard deviation (n = 3). ^^p or θ θp or ω ωp < 0.01. ^^^p or θ θ θp or ω ω ωp < 0.001. ^ vs. NC; θ vs. AQP3; ω vs. FTO.
Data availability statement
The analyzed datasets generated during the study are available from the corresponding author upon reasonable request.