
Figures & data
Figure 1. Workflow of our study. At stage I, the analytic renal pathology system (ARPS) was established. A dataset consisting of 41,000 patches obtained from 400 native immunoglobulin A nephropathy (IgAN) patients was utilized, with the patches carefully labeled for the location and identification of glomeruli lesions (GS, SS, C and NOA). Moreover, for the identification of intrinsic glomerular cells, we selected and labeled 460 images of glomeruli (about 70 000 cells, including M, E and P) from NOA samples. The ARPS system exhibited exceptional performance in accurately categorizing glomerular lesion types and intrinsic glomerular cells (Citation13). Stage II is allograft tissue compartment recognition, where periodic acid-Schiff (PAS) slides of allograft IgAN patients were scanned and then uploaded. After that, the ARPS identified the glomerular lesions and internal glomerular structures using U-Net, DenseNet, LSTM-GCNet and 2D V-Net. Stage III is the whole-slide image (WSI) clinical investigation, where we evaluated the reliability of the ARPS relative to ground truth (evaluated by a pathologist) in identifying glomerular lesions and internal glomerular structures. Meanwhile, the glomerular area, mesangial area, glomerular lesions (SS, GS, C and NOA) and intrinsic glomerular cells (M, E and P) automatically identified by the ARPS were further examined through association with clinical data and post-transplantation graft survival.
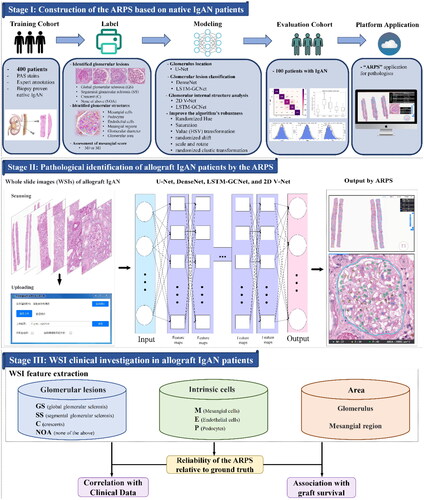
Table 1. Demographic And clinical characteristics of patients with allograft IgA nephropathy (IgAN) from internal validation center.
Figure 2. Identification of glomerular lesion types and intraglomerular structures in periodic acid–Schiff (PAS) slides from allograft IgAN patients by the analytic renal pathology system (ARPS). (A) A section of a whole slide image (WSI) from allograft IgAN patients. (B) Segmentation and location of glomerular lesion types in the WSI by the ARPS. Each glomerulus is categorized into global glomerular sclerosis (green), segmental glomerular sclerosis (yellow), crescents (red), and none of the above (blue). [
 ], the intrinsic glomerular cell was not identified and located; [
![Figure 2. Identification of glomerular lesion types and intraglomerular structures in periodic acid–Schiff (PAS) slides from allograft IgAN patients by the analytic renal pathology system (ARPS). (A) A section of a whole slide image (WSI) from allograft IgAN patients. (B) Segmentation and location of glomerular lesion types in the WSI by the ARPS. Each glomerulus is categorized into global glomerular sclerosis (green), segmental glomerular sclerosis (yellow), crescents (red), and none of the above (blue). [Display full size], the glomerular lesion was identified incorrectly. (C) A glomerulus (none of the above) in a WSI. (D) Intrinsic glomerular cell segmentation and identification, including mesangial cells (blue), endothelial cells (yellow), podocytes (green), and glomerulus boundary. [Display full size], the intrinsic glomerular cell was not identified and located; [Display full size], the intrinsic glomerular cell was identified incorrectly; [Display full size], other internal glomerular structure was misidentified as intrinsic glomerular cell. (E) Location of mesangial region and mesangial cells.](/cms/asset/bc04560b-bfac-43bb-8cc5-b75163a17930/irnf_a_2322043_f0002_c.jpg)
Figure 3. Metrics of the analytic renal pathology system (ARPS) on identifying glomerular lesions and intrinsic glomerular cells in allograft IgAN patients from the internal and external validation center. (A-B) Metrics of the ARPS on identifying glomerular lesions. (C-D) Metrics of the ARPS on identifying intrinsic glomerular cells. AUC-ROC, Area Under the Curve-Receiver Operating Characteristic; GS, global glomerular sclerosis; SS, segmental glomerular sclerosis; C, crescents; NOA, none of the above; M, mesangial cells; E, endothelial cells; P, podocytes. (E) Kappa agreement testing between the ARPS and a pathologist.
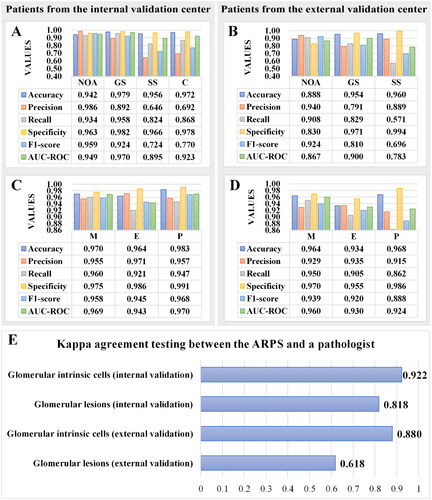
Table 2. ICCs Of glomerular lesions in different cohorts.
Figure 4. Correlation of mesangial digital features with Oxford mesangial hypercellularity score. M score, mesangial hypercellularity score from the Oxford classification of IgA nephropathy (Citation19, Citation20). Cases in which more than half the glomeruli contain more than three cells in a mesangial area is categorized as M1, and conversely, were categorized as M0. P values and correlation coefficients were calculated from Spearman’s correlation test.
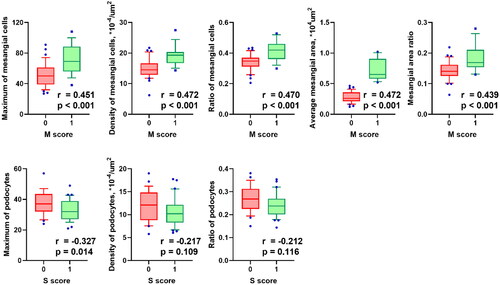
Figure 5. Kaplan–Meier curves of intrinsic glomerular cells identified by the analytic renal pathology system (ARPS) in high-level and low-level groups. E-max, maximum of endothelial cells; E-ratio, ratio of endothelial cells; P-max, maximum of podocytes; P-density, density of podocytes. P values were calculated by log-rank tests.
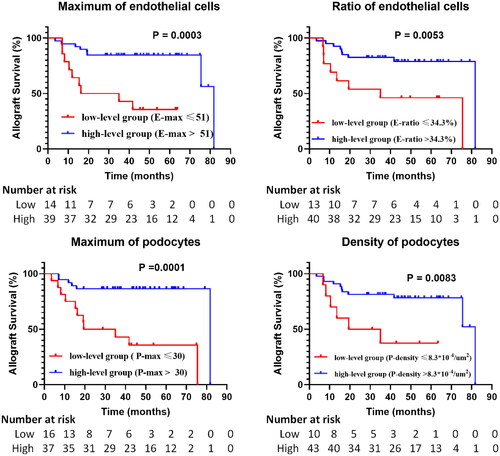
Table 3. Proportional Cox regression model assessing clinicopathological predictors of allograft failure.
Supplemental Material
Download PDF (512 KB)Data availability statement
The data underlying this article will be shared on reasonable request to the corresponding author.