
Figures & data
Figure 1. Flow chart illustrating the protocol.
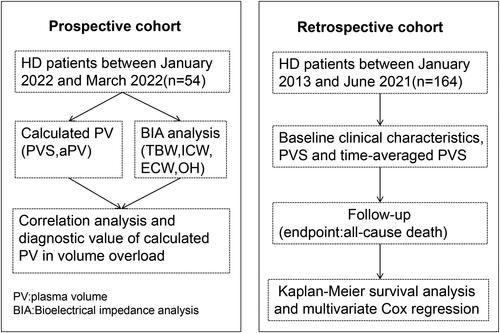
Table 1. Clinical and demographic characteristics of HD patients (n = 54).
Table 2. Correlation between calculated PV and parameters measured by BIA, NT-ProBNP and blood pressure.
Figure 2. Receiver-operating characteristic (ROC) curve analysis showing the prognostic values of PVS (A) and aPV (B) in predicting volume overload.
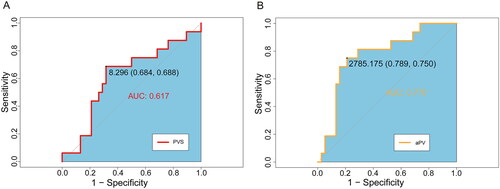
Figure 3. Correlation between ultrafiltration volume and decreased PVS (A) and aPV (B).
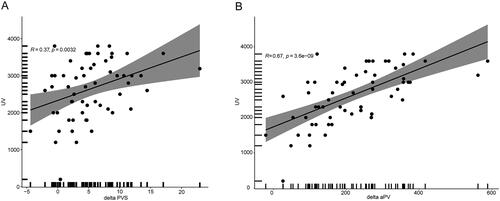
Figure 4. Kaplan-Meier analysis depicting all-cause deaths in HD patients with high and low time-averaged PVS.
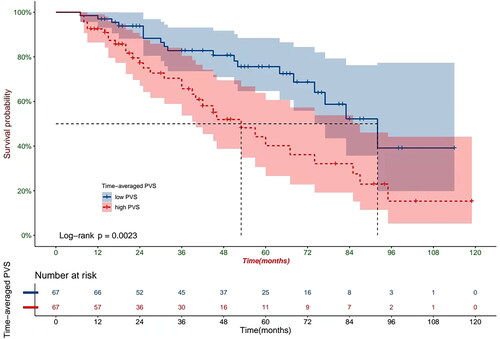
Table 3. Comparison of surviving and non-surviving HD patients: potential risk factors associated with mortality (n = 164).
Table 4. Univariate and multivariate Cox proportional hazard analyses for predicting all-cause mortality.