
Figures & data
Table 1. Primer sequences.
Figure 1. Serum levels of miR-16-5p were increased in S-AKI patients. (A) MiR-16-5p levels in healthy children and children with S-AKI. (B) Analysis of the linear correlation between miR-16-5p and Scr levels in children with S-AKI. (C) The receiver operating characteristic curve of miR-16-5p, KIM-1 and NGAL predicted S-AKI. The AUC were 0.9188, 0.8472, and 0.7556, respectively. (D) qRT–PCR analysis of serum KIM-1 and NGAL levels in healthy children and S-AKI children. n ≥ 9, *p < 0.05, **p < 0.01.
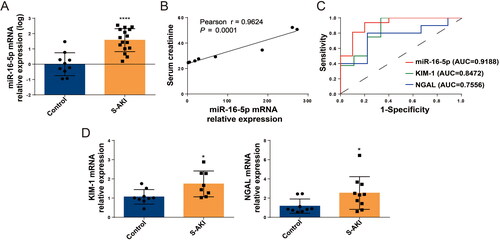
Figure 2. Overexpression of miR-16-5p aggravated LPS-induced S-AKI. (A) Scr and BUN levels after 12 h of treatment with normal saline and LPS (n ≥ 8). (B) Serum inflammatory factor levels after saline and LPS treatment for 12 h by ELISA (n = 10). (C and D) HE staining images and pathological scores of mouse kidney tissue treated with normal saline and LPS (n = 6). Scale bar, 50 μm. (E and F) Expression levels and quantitative analysis of KIM-1 and NGAL in mouse kidney tissues by western blotting (n = 6). (G) Expression levels and quantification of KIM-1 in mouse kidney tissues by IHC. Scale bar, 50 μm. (H and I) qRT–PCR analysis of KIM-1, NGAL, inflammatory cytokines and miR-16-5p levels in mouse kidney tissue (n ≥ 5). (J) qRT–PCR analysis of miR-16-5p levels in miR-16-5p-overexpressing HK-2 cells (n ≥ 4). (K and L) Expression levels and quantitative analysis of KIM-1 and NGAL in LPS-stimulated miR-16-5p-overexpressing HK-2 cells by western blotting (n = 4). (M) qRT–PCR analysis of KIM-1, NGAL, inflammatory cytokines, and miR-16-5p levels in LPS-stimulated miR-16-5p-overexpressing HK-2 cells (n ≥ 4). *p < 0.05, **p < 0.01, ***p < 0.001, ****p < 0.0001.
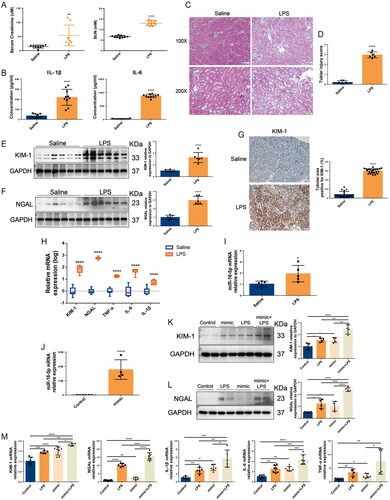
Figure 3. Knockdown of miR-16-5p significantly alleviated S-AKI in HK-2 cells induced by LPS. (A) Cell viability of HK-2 cells treated with LPS (n = 8). (B and C) Expression levels and quantitative analysis of KIM-1 and NGAL in HK-2 cells treated with different concentrations of LPS by western blotting (n = 4). (D and E) qRT–PCR analysis of KIM-1, NGAL, inflammatory cytokines and miR-16-5p levels in HK-2 cells treated with LPS (n ≥ 4). (F) qRT–PCR analysis of miR-16-5p levels in HK-2 cells that inhibit miR-16-5p (n ≥ 4). (G) qRT–PCR analysis of KIM-1, NGAL, and inflammatory factor levels in LPS-stimulated miR-16-5p knockdown HK-2 cells (n ≥ 4). (H and I) Expression levels and quantitative analysis of KIM-1 and NGAL in LPS-stimulated miR-16-5p knockdown HK-2 cells by western blotting (n = 4). *p < 0.05, **p < 0.01, ***p < 0.001, ****p < 0.0001.
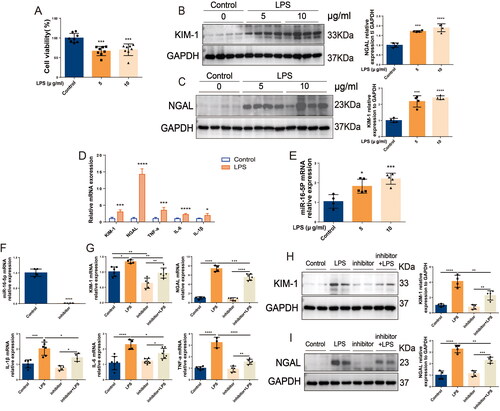
Figure 4. In S-AKI, upregulation of miR-16-5p improves apoptosis of renal tubules. (A) Targeted binding sequence of hsa-miR-16-5p to the 3’-UTR end of bcl-2. (B and C) Expression levels and quantification of bax, bcl-2, and caspase-3 in mouse kidney tissues by IHC. Scale bar, 50 μm. (D and E) Expression levels and quantitative analysis of bax, bcl-2, and caspase-3 in mouse kidney tissues by western blotting (n = 6). (F) qRT–PCR analysis of bcl-2 expression levels in HK-2 cells treated with different concentrations of LPS (n ≥ 3). (G and H) Expression levels and quantification of bax and bcl-2 in LPS-stimulated miR-16-5p overexpressing HK-2 cells by western blotting (n = 4). *p < 0.05, **p < 0.01, ***p < 0.001, ****p < 0.0001.
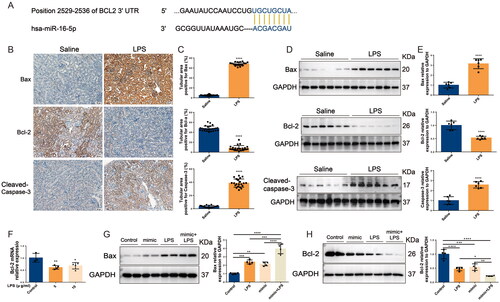
Figure 5. Inhibition of miR-16-5p alleviates HK-2 cell apoptosis. (A-C) Expression levels and quantification of bax, bcl-2, and caspase-3 in HK-2 cells treated with different concentrations of LPS by western blotting (n = 4). (D and E) Apoptosis levels and quantification of apoptotic cells in LPS-treated HK-2 cells by flow cytometry (n = 6). (F and G) Expression levels and quantification of bax and bcl-2 in LPS-stimulated miR-16-5p knockdown HK-2 cells by western blotting (n = 4). **p < 0.01, ****p < 0.0001.
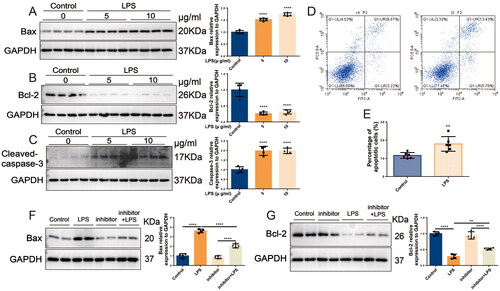
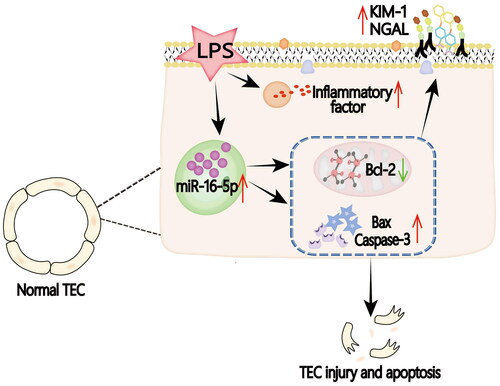
Figure 6. Graphical abstract. In the LPS-induced S-AKI model, the expression of miR-16-5p is significantly upregulated by mediating the occurrence of apoptosis, thus aggravating S-AKI.
Availability of data and materials
The original contributions presented in the study are included in the article, and further inquiries can be directed to the corresponding authors.